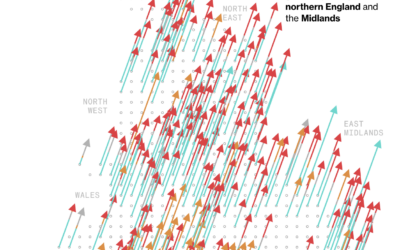
Speaking of Conservatives losing, Andre Tartar and Demetrios Pogkas for Bloomberg show the…
Nathan Yau
-
UK party gains and winners
-
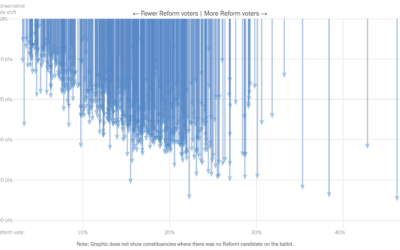
Conservatives lose UK election by a lot
For the New York Times, Josh Holder and Lauren Leatherby show how the…
-
Visually navigate code as stars and galaxies
Andrei Kashcha visualized major software packages as galaxies that you can fly through.…
-
Seeing the world after Google Streetview
Trevor Rainbolt is really good at geolocating a place given a single frame…
-
FlowingData at 17
Last week marked 17 years running this small corner of the internet on…
-
Shrinking down to the size of an atom
{“@context”:”http:\/\/schema.org\/”,”@id”:”https:\/\/flowingdata.com\/2024\/07\/02\/shrinking-down-to-the-size-of-an-atom\/#arve-youtube-rn9dkv4svyq”,”type”:”VideoObject”,”embedURL”:”https:\/\/www.youtube.com\/embed\/rn9dkV4sVYQ?feature=oembed&iv_load_policy=3&modestbranding=1&rel=0&autohide=1&playsinline=0&autoplay=0″}
In a different take on showing the scale of very tiny things,…
-
Age differences between world leaders and the populations they serve
The ages of American presidential candidates are old when compared to the ages…
-
Estimating Covid deaths
It’s impossible to know the exact number of Covid deaths worldwide, because consistent…
-
Members Only
Visualization Tools and Learning Resources, June 2024 Roundup
Here is the good stuff for the month.
-
Searching for the hardest and easiest Spelling Bee puzzels
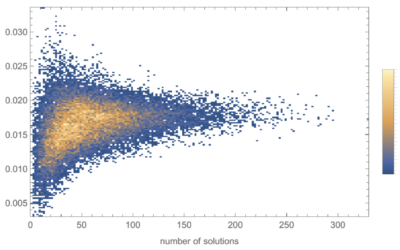
Christopher Wolfram explains his “unnecessarily detailed analysis” of the spelling game from the…
-
Decade-Long Battle for “Yogurt” vs. “Yoghurt” on Wikipedia
After years of enthusiastic discussions, editors eventually and begrudgingly came to a conclusion.
-
Changing climate zones of major cities
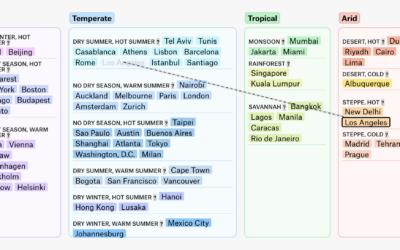
A global map of climate change can make a few degrees of rising…
-
Trendy baby name sounds
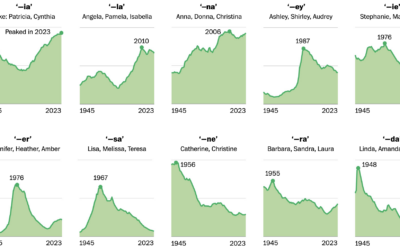
For WP’s Department of Data, Daniel Wolfe analyzed baby name data with Laura…
-
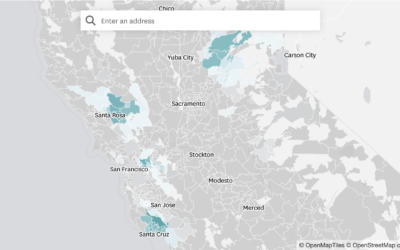
Where State Farm Insurance is dropping home policies
State Farm won’t be renewing about 30,000 policies because of high wildfire and…
-
Members Only
Games to Explore Data and Possibilities
Visualization and analysis is usually about minimizing uncertainty to more clearly see patterns. On the other hand, games force you to play through uncertainty.
-
Perplexity is probably stealing content
For Wired, Dhruv Mehrotra and Tim Marchman provide evidence that Perplexity, an AI-based…
-
AI-generated email from a friend
Neven Mrgan describes what it was like to get an AI-generated email from…
-
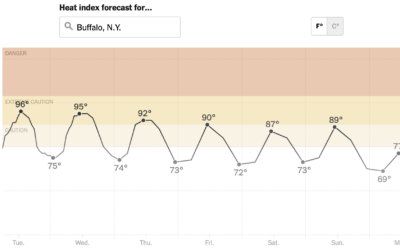
Heat tracker for the U.S.
It’s abnormally hot in a large portion of the United States, and it’s…
-
See Who is Older and Younger than You
As you get older, it might start to feel like everyone is getting younger around you. At what point are you older than the majority?
-
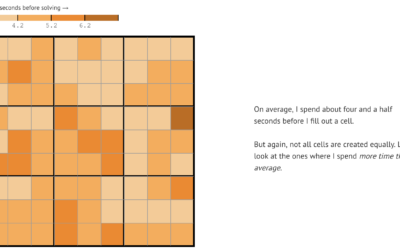
Analysis of Sudoku play patterns
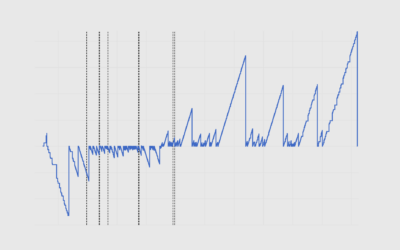
Vivek Rao likes to play Sudoku, enough that he collected data on his…






 Visualize This: The FlowingData Guide to Design, Visualization, and Statistics (2nd Edition)


