“Make statistics as relevant to your audience as possible and put the numbers into a context that people can instantly grasp.” [via]
Nathan Yau
-
Link
Presentation skills →
-

Patterns of daily life in Netherlands from Above
In a similar fashion to their work in Britain from Above, CGI and…
-
Link
Getstats →
Campaign by the Royal Statistical Society to help the general public understand and not shy away from statistics [via]
-
Link
Creating Animated Bubble Charts in D3 →
Use of Force layout, collision detection, and transitions to make this graphic from The New York Times
-
Link
Timetoast →
Lets you easily create online and interactive, event-based timelines and share them
-
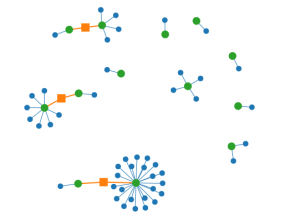
Password reuse visualizer from Mozilla
When you use the same password for every online account, there could be…
-
Link
Must-Have R Packages for Social Scientists →
Oldie but a goodie
-
Link
When open data is not open →
World Bank snuggles up with Google
-
Live coding and inventing on principle
This talk by Bret Victor caught fire a few days ago, but I…
-

Point guard fundamentals of Jeremy Lin
You knew this was coming, right? The New York Times describes the point…
-
Link
iBook Widgets with D3.js →
Getting closer to interactive text books
-
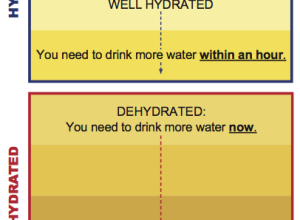
Urine color chart
A Boy Scout is always prepared.
See also: Bristol stool chart.…
-
Link
OkCupid Trends process →
“The trick, in so far as I’ve observed one, is to pick questions first before you let the data be your guide.”
-
Companies learn your secrets with data about you
In the 1980s, students and researchers at UCLA, led by marketing professor Alan…
-
Link
Tufte carves out new life as sculptor →
He does art nowadays, and talks with the BBC how science influences his work
-
Link
Narrative Eros of the Infographic →
Survey of visual storytelling
-
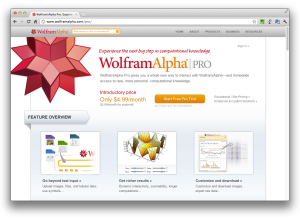
WolframAlpha Pro launches in an effort to democratize data science
Taking the next step in the Wolfram|Alpha experiment, Wolfram launches a Pro version…
-
Link
Data Stories →
Visualization podcast with a blend of research and in-practice. The first episode has some choppy spots, but it’ll get better.
-
Link
How to create a visualization →
Play, ask a question, sketch, crunch, and build
-
Link
Avoid inbreeding with online database →
“When you live in an isolated nation with a population roughly the size of Pittsburgh, accidentally lusting after a cousin is an all-too-real possibility.”
Recently for Members
Second Edition
 Visualize This: The FlowingData Guide to Design, Visualization, and Statistics (2nd Edition)
 Visualize This: The FlowingData Guide to Design, Visualization, and Statistics (2nd Edition)
New tools, refined process.
Browse by Chart Type See All →


