This week, we refresh an old chart with new data, interaction, and improved design.
Nathan Yau
-
Members Only
Outside the bubbles
-

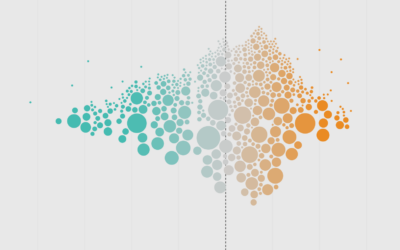
Poor geometry in deepfake images
Science profiled Hany Farid, a researcher in digital forensics at the University of…
-
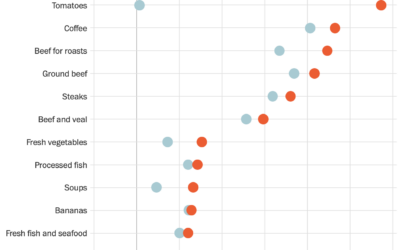
Rising prices at the grocery store
The U.S. Bureau of Labor Statistics published cost estimates for April 2026. If…
-
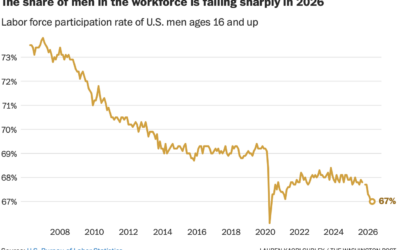
Men leaving the workforce
The percentage of U.S. men in the workforce has been declining for decades,…
-
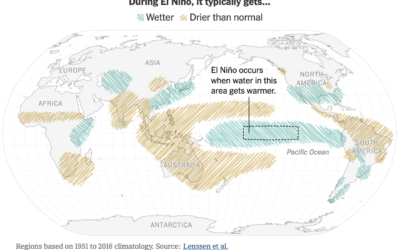
Effects of El Niño, a map
Raymond Zhong and Harry Stevens, for the New York Times, go with a…
-
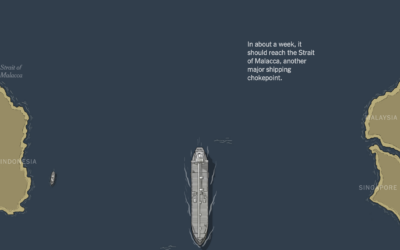
Getting oil to the gas tank from the Strait of Hormuz
For the New York Times, Agnes Chang and Pablo Robles illustrate the journey…
-
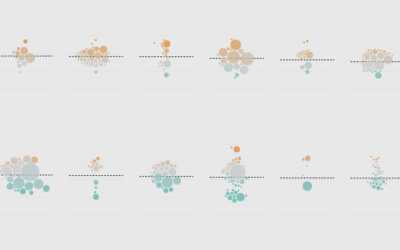
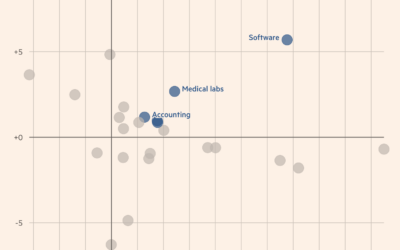
Occupations with the highest divorce rates
Some jobs tend towards higher divorce rates and some lower.
-
State healthcare sites sending data to tech companies
For Bloomberg, Tanaz Meghjani, Dhruv Mehrotra, and Surya Mattu report sharing of private…
-
Members Only
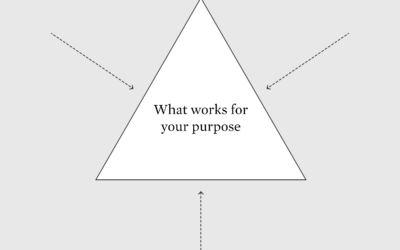
Restraint in the visualization process
This week is about constraints.
-

Visualizing history within a grid
For the Public Domain Review, Hunter Dukes and Adam Green visit Antoni Jażwiński’s…
-
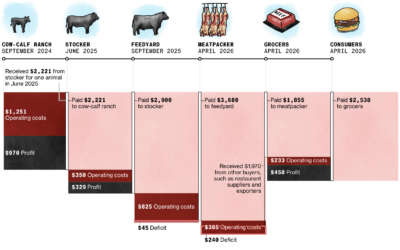
Increasing costs in the beef supply chain
Beef prices keep going up a noticeable amount in grocery stores. For Bloomberg,…
-

Cartographers review movie maps
John Nelson and Peter Atwood review maps that appeared in movies, such as…
-
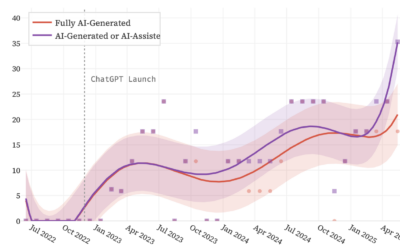
Estimating how much text on the internet is generated
Researchers analyzed newly published websites from 2022 through mid-2025 to estimate what percentage…
-
Past job transformations, because of technology
It seems every day the chances that AI transforms work trends towards certain.…
-
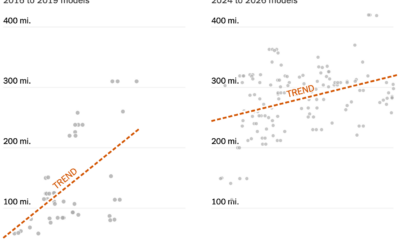
EVs getting cheaper to go farther
The cost of an electrical vehicle used to increase quickly as you shopped…
-
Members Only

Visualization tools and resources, April 2026 roundup
Every month I collect tools, datasets, and resources to help you make more useful data things. Here is what happened in April.
-
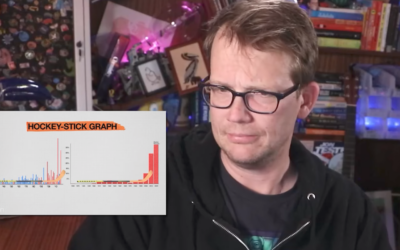
Masterclass in misleading charts
Hank Green dissects a video that argues against climate change. The video in…
-
Writing style as your digital fingerprint
Apparently, the words we use and how we structure our sentences in writing…
-
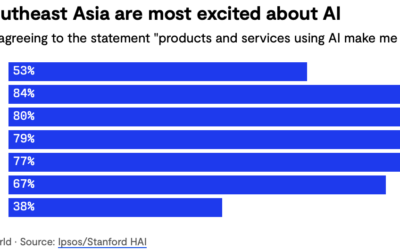
Asia is a lot more excited about AI than the U.S. is
For Rest of World, Rina Chandran reports on the big difference in excitement:…
-
Ethics in the way of scale
For NYT Opinion, Paul Ford on the challenges for AI companies to build…
Recently for Members
Second Edition
 Visualize This: The FlowingData Guide to Design, Visualization, and Statistics (2nd Edition)
 Visualize This: The FlowingData Guide to Design, Visualization, and Statistics (2nd Edition)
New tools, refined process.
Browse by Chart Type See All →


