Adam Pearce charted minute-by-minute point differentials for NBA games during the 2014-15 season.…
-
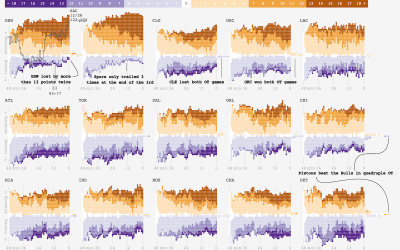
Small multiples for NBA game differentials
-
Link
Yahoo News feed dataset for researchers →
A big ol’ dataset on interaction with the list of news items on the homepage.
-
Link
Grid map showdown →
A quantitative look at which US grid layout is best.
-
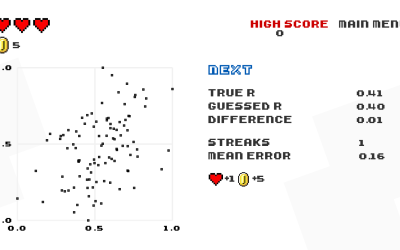
Game: Guess the correlation
Guess the Correlation is a straightforward game where you do just that, and…
-

Sum of life’s parts
What if you relived life’s activities in big clumps? Thirty years of sleeping…
-
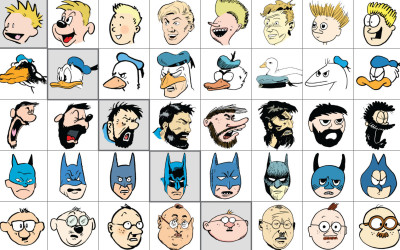
Same source, different styles →
Jaakko Seppälä drew ten comic characters, each in its original style and in…
-

Satellite time-lapse of Earth
Charlie Loyd, who works with satellite imagery at Mapbox, put together a 12-second…
-
Link
Little boxes →
It must be that time of year again when practitioners try to define visualization. It’s a medium. It’s continuous.
-
Link

Experimentation with globes in Blender 3D →
There’s also a collection of video tutorials on how to use QGIS to greater effect.
-
Amanda Cox is new editor of The Upshot
So great and well-deserved.
-

Playing with fonts using neural networks
Erik Bernhardsson downloaded 50,000 fonts and then threw them to the neural networks…
-
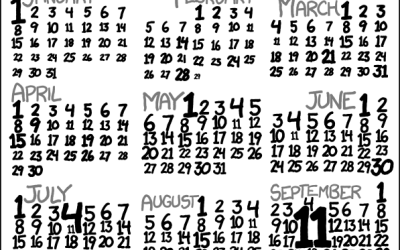
Missing 11th of the month
David Hagan looked closer at why the 11th of the month appeared to…
-
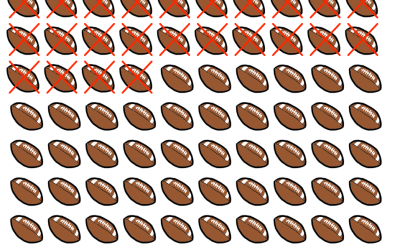
Counting your days left with emoji
While we’re on the topic of life expectancy, Tim Urban of Wait But…
-
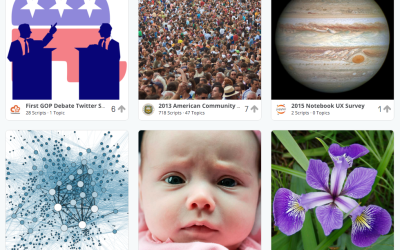
Kaggle Datasets for a place to converge on public data
Kaggle just opened up a Datasets section to download and analyze public data.…
-
US Census Bureau open source
It took forever and it’s way overdue, but the United States Census Bureau…
-

How You Will Die
So far we’ve seen when you will die and how other people tend to die. Now let’s put the two together to see how and when you will die, given your sex, race, and age.
-
Nerdy Powerball FAQ
The Powerball FAQ was most likely written by a slightly annoyed statistician. You’d…
-
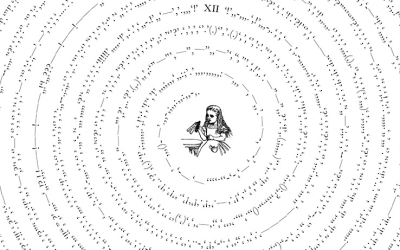
Punctuation only in literary works
What do you get if you take famous literary works, strip out all…
-
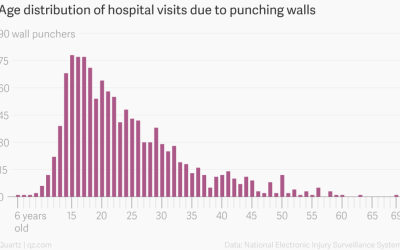
Data on people who went to ER for wall-punching
Keith Collins for Quartz ran some quick numbers for people who visited the…
-

NYPL public domain data
The New York Public Library just made over 180,000 digital items in the…
Recently for Members
Second Edition
 Visualize This: The FlowingData Guide to Design, Visualization, and Statistics (2nd Edition)
 Visualize This: The FlowingData Guide to Design, Visualization, and Statistics (2nd Edition)
New tools, refined process.
Browse by Chart Type See All →


