Ritchie King for Quartz compared money spent on Super Bowl ads — now…
-
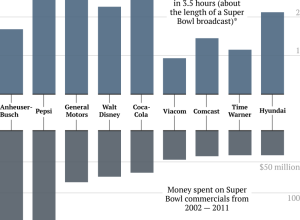
Super Bowl ad costs vs. company profit during game
-
Link
Start Paying Attention to ‘Long Data’ →
The need for big/small/long data terminology is stupid, but the main points are valid
-
Link
How much is mapping worth →
A comeback for geography
-
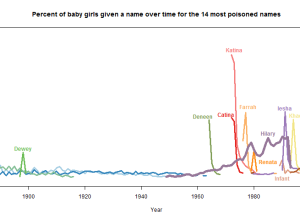
The most poisoned name in US history
Biostatistics PhD candidate Hilary Parker dived into the most poisoned names in US…
-
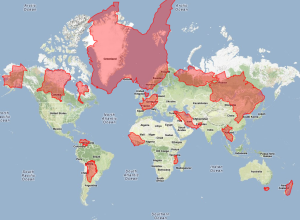
Mercator map puzzle
The Mercator projection can be useful for giving directions, but when it comes…
-
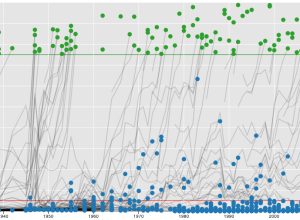
Baseball Hall of Fame voting trajectories
Carlos Scheidegger and Kenny Shirley, along with Chris Volinsky, visualized Major League Baseball…
-
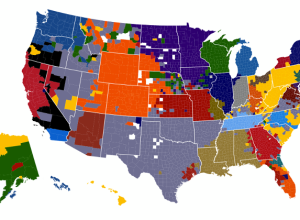
NFL fans on Facebook, based on likes
As the Super Bowl draws near, Facebook took a look at football fandom…
-
Link
Heritage Open mHealth Challenge →
Help improve health care with data; $100k prize
-
Link
svg.js →
A lightweight library for manipulating and animating SVG
-
Ten years of cumulative precipitation
We’ve all seen rain maps for a sliver of time. Screw that. I…
-
Link
Dogs of NYC →
Map of most popular dog names and types by area
-
Link
Candyland →
An analysis of the board game and gameplay
-
Internet Explorer causation
I’m almost certain this relationship is significant. Side note: Is there a meaningless-correlations…
-
Evolution of science fiction covers in color →
Arthur Buxton plotted the most common colors of Penguin Publishing science fiction colors…
-
Link
Shiny Server →
Run R applications online
-
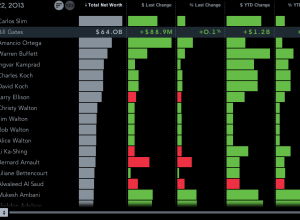
Billionaires of the world ranked and charted
How wealthy are the richest people in the world? How do they compare…
-
Link
Ayasdi →
A tool that advertises “automatic insights” from complex data, looks like mainly with clustering and network graphs
-
Link
Vintage American Infographics →
Small collection of graphics from mid-19th century
-

Data Points: First look
For the past year, I’ve been working on Data Points: Visualization that Means…
-

Slitscanning online videos
Thanks to Sha Hwang, you can now siltscan videos on YouTube and Vimeo…
Recently for Members
Second Edition
 Visualize This: The FlowingData Guide to Design, Visualization, and Statistics (2nd Edition)
 Visualize This: The FlowingData Guide to Design, Visualization, and Statistics (2nd Edition)
New tools, refined process.
Browse by Chart Type See All →


