Lance Hosey, for The New York Times, on design, beauty, and functionality.
We…
-
Loving beautiful things
-
Link
Interview with Google statistician →
Experiences analyzing lots of data and collaborating with computer scientists, data scientists, and quantitative analysts
-
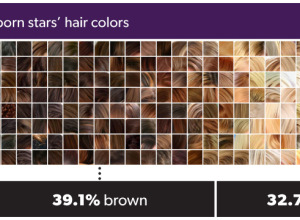
Porn star demographics
Jon Millward explored porn star demographics using a data scrape from the Internet…
-
A shroud of cold air descends on the U.S.
From NOAA, an animation showing a wave of cold during the Martin Luther…
-
Link
Chart Check: Did Obama’s Graphics ‘Enhance’ His Big Speech? →
Helped out some for this NPR article
-
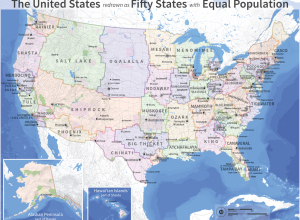
Redrawn United States of electoral votes
Neil Freeman reimagined state boundary lines based on population. He started with an…
-
Visualization spectrum
A handful of experts weighed in on visualization as a spectrum rather than…
-
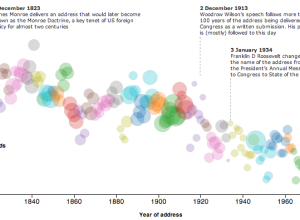
State of the Union address decreasing reading level →
With the State of the Union address tonight, The Guardian plotted the Flesh-Kincaid…
-
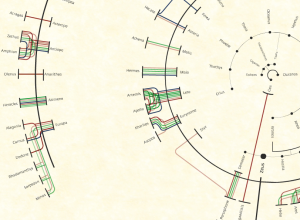
The many relationships of Zeus
Viviana Ferro, Ilaria Pagin, and Elisa Zamarian had a look at all of…
-
Link
iWantHue →
Automatically make a color palette based on color space
-
A fill-in-the-blank book to journal your life in graphs
My friends just got this for me, and it’s pretty much the perfect…
-
Link
Artists use data to make political statements →
Bringing the human to data
-
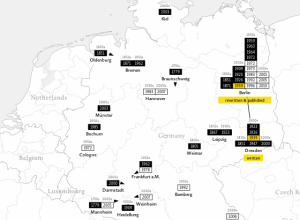
Mapping translations of Othello
Tom Cheesman of Swansea University, along with Kevin Flanagan and Studio NAND, dives…
-
Link
R Google Analytics →
Analyze web traffic [via]
-
Analysis of LEGO brick prices over the years
Reality Prose has an excellent analysis on the changing price of LEGO bricks…
-
Philosophy of data
David Brooks for The New York Times on the philosophy of data and…
-
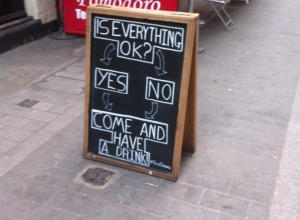
Local pub flowchart
From Reddit user ddurrr while visiting London. Pretty much my current status and…
-
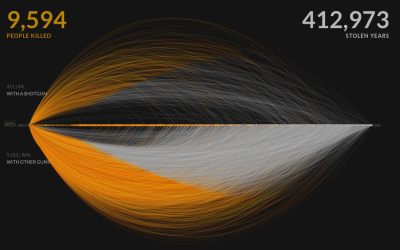
A visual exploration of US gun murders
Information visualization firm Periscopic just published a thoughtful interactive piece on gun murders…
-
Link
Arc Diagrams in R →
Using this Protovis example with Les Misérables
-
Time running parallel
In Waters Re~ artist Xárene Eskandar placed video of the same landscape at…
Recently for Members
Second Edition
 Visualize This: The FlowingData Guide to Design, Visualization, and Statistics (2nd Edition)
 Visualize This: The FlowingData Guide to Design, Visualization, and Statistics (2nd Edition)
New tools, refined process.
Browse by Chart Type See All →


