2 gigs of cat data with images and eye, mouth, and ear positions. Yeah.
-
Link
Cat Dataset →
-
Link
Data science on Wikipedia →
I guess it’s official now
-
Link
slitscanner.js →
Make a sound sculpture from any YouTube video
-
silenc: Removing the silent letters from a body of text
During a two-week visualization course, Momo Miyazaki, Manas Karambelkar, and Kenneth Aleksander Robertsen…
-
Link
Treasure island of infographic textbooks →
A look back on an old collection
-
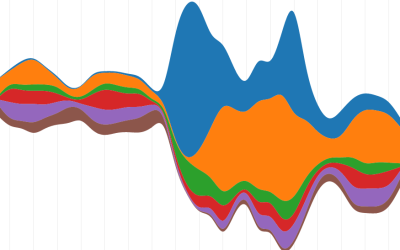
How to Animate Transitions Between Multiple Charts
Animated transitioning between chart types can add depth to your data display. Find out how to achieve this effect using JavaScript and D3.js.
-
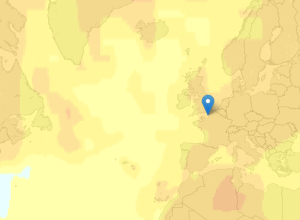
Global temperature rises over past century
New Scientist mapped global temperature change based on a NASA GISTEMP analysis.
The… -
Link
OpenVis Conf →
Still building the speaker list, but Amanda Cox is the keynote speaker, so it should be worth it just to hear her talk.
-
Link
Tapestry conference →
“weaving stories and data”
-
Using data to find a husband
When it was time to settle down with the right man, Amy Webb…
-
Link
Bicoastal Datafest →
On February 2 and 3, analyze money’s influence on politics
-
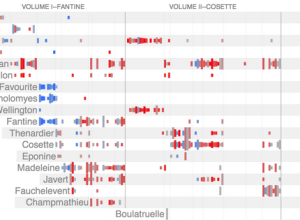
Character mentions in Les Miserables
Jeff Clark took a detailed look at Victor Hugo’s Les Miserables via character…
-
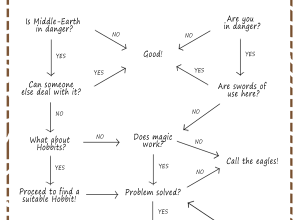
Flowchart: Gandalf problem solving →
The Lotr Project breaks down the thought process in the magical mind.…
-
Link
Elements of Statistical Learning →
Free PDF download version for second edition of book [via]
-
Link
How a Civil War Vet Invented the American Infographic →
Creator of the first Statistical Atlas of the United States
-
Series of concentric circles emanating from glowing red dot
Run for your lives. The red concentric circles on the green squiggly are…
-
Link
Animated GIFs in R →
-
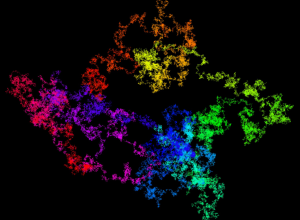
Random walk on pi →
By Francisco Javier Aragón Artacho, “This is a walk made out of the…
-
Link
The myth of the missing Data Scientist →
An argument against the buzz around the dire need for data scientists; some stuff to disagree with but some good points
-
Link
Without Human Insight →
Big data is just a bunch of numbers; computers will do the brute force labor, but you still have to use your brain.
Recently for Members
Second Edition
 Visualize This: The FlowingData Guide to Design, Visualization, and Statistics (2nd Edition)
 Visualize This: The FlowingData Guide to Design, Visualization, and Statistics (2nd Edition)
New tools, refined process.
Browse by Chart Type See All →


