Who else has been enjoying the Olympics as much as I have? I…
-
Awesome Olympics Coverage By The New York Times
-

Many Eyes Adds Wordle to its Extensive Visualization Toolbox
I’m sure you’ve seen Wordle by now, which puts an artistic spin on…
-

From the Forums: Challenges, Data, Questions
The FlowingData forums have been up for a few weeks now, and it’s…
-

I’ll Take My Infographic in Bright Orange, Men’s Medium
The Shirt Project, by Rich Watts and Louise Ma, takes the infographics out…
-
Britain From Above – Beautiful Use of Satellite Technology
The BBC has a gorgeous documentary series that started yesterday — Britain from…
-

Watch the Rise of Gasoline Retail Prices, 1993 – 2008
“What do the data look like for gasoline prices?” The prices go up, then down, then up, down, up…
-
It’s Like Google Maps with Sim City 2000 – OnionMap
Remember SimCity 2000? That was a great game. That was probably the last…
-
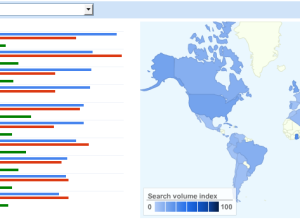
Google Releases Insights for Search – India Likes Data
Google announced Insights for Search yesterday. Think Google Trends but with more information…
-
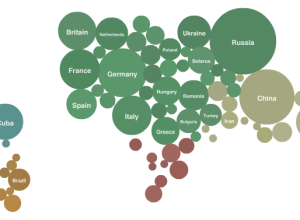
Map of Olympic Medals in Bubble + Geographic Form
Lee Byron, Amanda Cox and Matthew Ericson of the New York Times graphics…
-
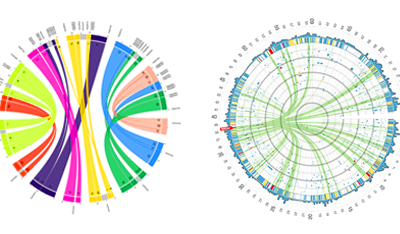
Visualize Genomes and Genomic Data – Circos
Circos is a project by Martin Krzywinski that lets you upload genomic data…
-
Beginner’s Guide to FlowingData – A Guided Tour
Our FlowingData community went up from 2,641 subscribers last month to about 4,100,…
-
Will Dark Knight Beat Titanic for Biggest Movie of All Time? [POLL]
Christopher Nolan’s Dark Knight, starring Christian Bale and the late Heath Ledger, has…
-
New Version of Flare Visualization Toolkit Released
A new version of Flare, the data visualization toolkit for Actionscript (which means…
-
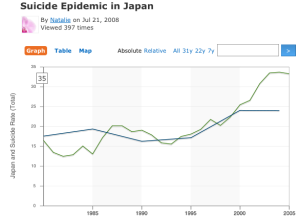
Can You Improve this Graph Showing Suicide Rates in Japan?
Are you ready for another deconstruct/reconstruct exercise? I just posted a time series…
-
A Taxi Cab Exploded in My Driveway
Through the Internet, sharing data has — you know what, I’m not even…
-
What Kind of Information is Hidden in Barcodes?
Barcodes. We all know what they look like. They’re the black stripes that…
-

Watching Our Twitter World – twittervision Redux
See what people are tweeting around the world 24/7. What are you doing right now?
-
There’s More Than One Way to Skin a Dataset
Last week I asked if you could improve a mediocre bar chart showing…
-
Mapping Walkability in San Francisco
Lee Byron, recent Carnegie Mellon grad and newly inducted New York Times graphics…
-
What Simple Rules Should You Always Follow When Designing Infographics?
In the FlowingData forums, Ryan asks a really good question about data design:…
Recently for Members
Second Edition
 Visualize This: The FlowingData Guide to Design, Visualization, and Statistics (2nd Edition)
 Visualize This: The FlowingData Guide to Design, Visualization, and Statistics (2nd Edition)
New tools, refined process.
Browse by Chart Type See All →


