The colmeia group recently installed their Caffeine Viewer project where they hacked their…
-
Hacking the Coffee Maker – Caffeine Viewer
-
FlowingData Cited in Forbes Magazine?
Whaaa? Cool beans.…
-
Statistical Graphics Conference – Jet Lag Wins. I Lose.
As you might have noticed, I haven’t been live blogging the Data Viz…
-
What Would You Like to See More of On FlowingData? [POLL]
With it being FlowingData’s birthday, it seems like a good time to get…
-

Happy One-Year Birthday, FlowingData!
It’s been one year since my rambling post on creating effective visualization. It…
-
Live Blogging Statistical Graphics From Germany This Week
For the next few days, I’m in Bremen, Germany for a conference on…
-
Coolest Design Job Ever – Infographics in the Movies
Mark Coleran has hands down one of the best jobs in the world.…
-

Weekend Minis For Your Lazy Weekend – 6/21/08
FlowingData on Alltop – Alltop describes itself as the digital magazine rack of…
-

Lisa Simpson on Happiness vs Intelligence
As intelligence goes up, happiness goes down. See, I made a graph. I…
-

An Experiment in Organic Software Visualization
This organic visualization, code_swarm by Michael Ogawa from UC Davis, has been making…
-
FlowingData Readers’ Favorite Visualizations
Last month I asked FlowingData readers, “What are your favorite data visualizations in…
-

What Do People Want to Do With Their Lives?
43 Things is a goal-setting community where people set goals, cheer each other…
-
How Much Time Do You Waste on Your Computer?
A few months ago, I started monitoring how I spent time on my…
-
How Much Does Gas Cost Where You Live?
With gas prices going crazy high lately, here’s this weekend’s question:
How much… -
Free Pizza and Beer at the Freebase User Group Meeting
Freebase is one of my two new favorite toys, the other being my…
-
12 Cool Visualizations to Explore Books
There’s reading a book, and then there’s looking at, exploring, and experiencing a book. That’s what visualization is for.
-
Personal Visualization for the Obsessive Compulsive
Ash Spurr, in a project to try to understand Obsessive Compulsive Disorder, took…
-
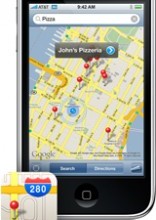
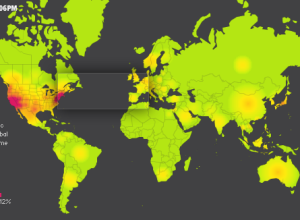
Citizen Science, Personal Sensing with GPS-Equipped iPhone (Among Others)
With the unveiling of the brand new iPhone 3G, Twitter has been buzzing…
-
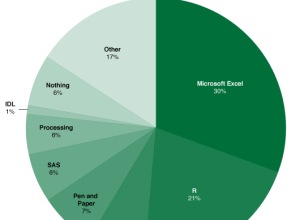
What Do You Use to Analyze and/or Visualize Data? [POLL RESULTS]
The most recent FlowingData poll asked what you use to analyze and/or visualize…
-

5 Types of Data Visualization People – What Type Are You?
Those interested in data visualization always seem to fall into one of these five categories.
Recently for Members
Second Edition
 Visualize This: The FlowingData Guide to Design, Visualization, and Statistics (2nd Edition)
 Visualize This: The FlowingData Guide to Design, Visualization, and Statistics (2nd Edition)
New tools, refined process.
Browse by Chart Type See All →


