Mashups have been around for a while now, but for the most part…
-

Mozilla Labs Ubiquity Plugin Makes Mashups Easy
-
Nike+ Human Race 10K – Racing Around the World
Nike+ is a device you hook up to your shoe and iPod Nano…
-
Best of FlowingData: August 2008
Last month, FlowingData had a pretty good month moving up to rank 4,130…
-
Tracking Hurricane Gustav – How Hard is it Going to Hit?
Stamen has taken a step towards the concrete with their recent Hurricane Tracker…
-
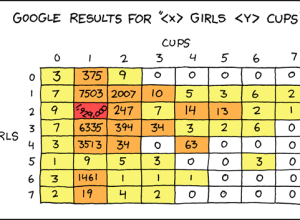
Google Results for X Girls, Y Cups
Some will find this amusing while others won’t get it at all. If…
-

How Open Should Open Source Data Visualization Be?
Is releasing my code the best thing to do for myself and the community or is it worth keeping some things private?
-
Keep Track of Presidential Race from Many Perspectives – perspctv
Keep track of what’s getting reported about the presidential race in somewhat realtime…
-
Look at My Neato Lollipop Chart – Widgenie
As some commented on an earlier post, FusionCharts provides an easy way for…
-

Plummeting Infographics from I.O.U.S.A – A Nation in Debt
I haven’t seen I.O.U.S.A. yet, but from the online bonus clips, it looks…
-
One Week Left for Personal Visualization Project
A quick announcement – I just wanted to remind everyone (and point out…
-
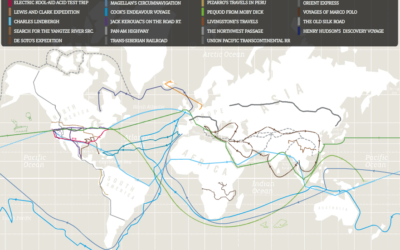
History’s Greatest Journeys – Wanderlust from GOOD
GOOD Magazine, in collaboration with Graham Roberts, maps the most famous journeys in…
-
Why is MC Hammer Talking About Analytics?
“Analytics, at the end of the day, is going to be the endgame.”…
-
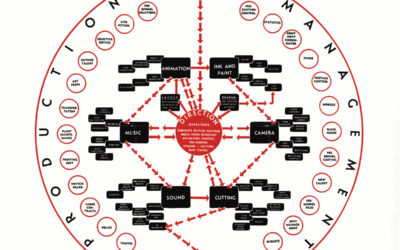
Amusing Disney Org Chart – From Walt on Down
I’m not sure how old this Disney org chart is, but I’m guessing…
-
Fleshmap: Studies of Desire – Touch, Look, and Listen
Fleshmap is a new project by Martin Wattenberg and Fernanda Viégas that explores…
-
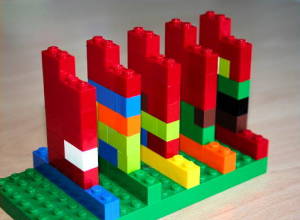
LEGO-powered Project Time Management
Speaking of physical graphs, looks it’s time management with my favorite childhood pastime…
-

Physical Graphs as Critique on American Culture
These wooden graphs by Joshua Callaghan show uh, something on the left and…
-
Join Me in Blog Action Day 2008
I hope you’ll consider joining me on Blog Action Day on October 15…
-
3 Worthwhile Alternatives to the Pie Chart
A while back I asked what you wanted to see more of on…
-
Tell Stories With Interactive Timelines from Dipity
Timelines, much like calendars, can be used to show changes over time in…
-
Is There a Market for Premium Online Data Visualization?
Visualization is coming out of the research lab and stepping into the market.
Recently for Members
Second Edition
 Visualize This: The FlowingData Guide to Design, Visualization, and Statistics (2nd Edition)
 Visualize This: The FlowingData Guide to Design, Visualization, and Statistics (2nd Edition)
New tools, refined process.
Browse by Chart Type See All →


