• Membership
  • Books
  • Projects
  • Learning
  • Newsletters
  • Member Login

  • Why Isn’t Data Visualization More Popular?

    Visualization

    Todd provides 5 reasons why data visualization isn’t more prevalent:

    People don’t know…

  • Flocking Up the National Nine News

    Infographics

    At the bottom of each article on National Nine News (Australian MSN), there’s…

  • Discover, Share, Publish, Distribute, and Subscribe to Data With blist

    Apps

    Today, Kevin Merritt, founder and CEO of blist, provides some background on putting…

  • I Heart Dilbert

    Miscellaneous

    Dilbert is one of the best comics ever.

  • Mapping the Human Diseasome With a Network Graph

    Infographics  /  New York Times

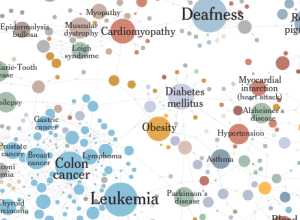
    Matthew Block and Jonathan Corum from The New York Times use a network…

  • Headed to California for a Few Days

    Site News

    A quick announcement: I’m headed back to California for a few days and…

  • Why Did Andy Dufresne Escape from Shawshank?

    Statistics

    To tell a complete and meaningful story, you need to have and provide all the context.

  • What Field of Expertise Do You Study or Work In? [POLL RESULTS]

    Polls

    Thank you to everyone who responded to last week’s poll: What Field of…

  • NewsWare Launches to Explore and Interact with News on msnbc.com

    Infographics

    NewsWare was launched yesterday on msnbc.com. It’s a set of apps, games, and…

  • American Consumers Spend More Money On Cheese than On Computers

    Infographics  /  New York Times, spending

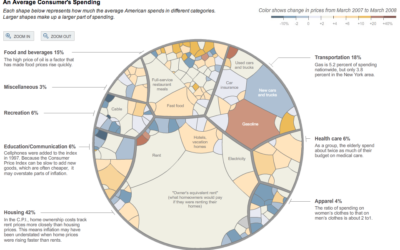
    In a deviation from the usual pie chart and standard tree map, this…

  • Weekend Minis for Your Lazy, Relaxing Weekend

    Miscellaneous

    Visualization Criticism – A criticism on the criticism on visualization. Robert Kosara, Fritz…

  • What Field of Expertise Do You Study or Work In? [POLL]

    Polls

    People from lots of different fields have emailed me during the course of…

  • Chart of the Day: A Breakdown of Facebook Applications

    Miscellaneous

    Of the 23,160 Facebook applications, I use about 5, but I probably wouldn’t…

  • Love, Hate, Think, Believe, Feel and Wish on Twitter

    Data Art

    Inspired by Jonathan Harris and Sep Kamvar’s We Feel Fine, and using data…

  • Why Should Engineers and Scientists Care About Color (and Design)?

    Design

    I studied electrical engineering and computer science in undergrad and now as a…

  • All 26 Million Road Segments in Continental United States

    Maps  /  Ben Fry, streets

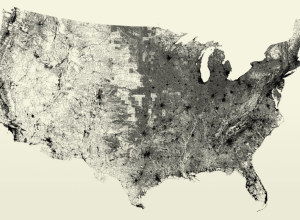
    Ben Fry maps every road segment in All Streets, according to the U.S.…

  • Data and Statistics For Human Rights

    Statistics

    Patrick Ball, a human rights statistician, finds truth in numbers while analyzing and…

  • Poverty Statistics that Make Sense – Welcome to Povertyville and Slumtown

    Statistical Visualization

    Dan Beech represents worldwide poverty in this video, which is actually a 3-dimensional…

  • Write a Guest Post for FlowingData

    Site News

    Early next month, I’m going to be traveling a bit. I’m headed back…

  • Rolling Out Your Own Online Maps and Graphs with HTML/CSS

    Maps, Statistical Visualization

    Wilson Miner and Paul Smith, two co-founders of Everyblock, post tutorials and a…

  • Page 12 of 18
  • <
  • 1
  • ...
  • 9
  • 10
  • 11
  • 12
  • 13
  • 14
  • ...
  • 18
  • >

Get access to courses, tutorials, and more resources.

Become a member →

Recently for Members

June 4, 2026
Visualization is not the goal

May 28, 2026
Visualization tools, resources, and data, May 2026 roundup

May 21, 2026
Weakness of a bar chart

May 14, 2026
Outside the bubbles

May 7, 2026
Restraint in the visualization process

Second Edition

Visualize This: The FlowingData Guide to Design, Visualization, and Statistics (2nd Edition)

New tools, refined process.

Order: Amazon / Bookshop

Browse by Chart Type See All →

Calendar Parallel Sets Donut Chart Force-Directed Graph Alluvial Diagram Step Chart Unit Chart Dot Density Map Ternary Plot Barcode Chart

Browse By Topic

  • Visualization

    Seeing data

  • Maps

    Seeing geographic data

  • Infographics

    Explaining data

  • Networks

    Connecting data

  • Statistics

    Analyzing data

  • Software

    Working with data

  • Sources

    Getting data

  • Design

    Making data readable

Made by FlowingData

  • The Process

  • Data Underload

  • Chart Everything

  • Guides

  • Books

  • Shop

  • About
  • Contact
  • LinkedIn
  • Bluesky
  • Instagram
  • RSS
Copyright © 2007-Present FlowingData. All rights reserved.