Wilson Miner and Paul Smith, two co-founders of Everyblock, post tutorials and a little bit of their own experiences rolling out their own maps and creating graphs with web standards.
Why Not Go With Google Maps?
Paul gets into the mechanics of how you can use your own maps discussing the map stack – browser UI, tile cache, map server, and finally, the data. My favorite part though was his reasons for going with their own maps:
Ask yourself this question: why would you, as a website developer who controls all aspects of your site, from typography to layout, to color palette to photography, to UI functionality, allow a big, alien blob to be plopped down in the middle of your otherwise meticulously designed application? Think about it. You accept whatever colors, fonts, and map layers Google chooses for their map tiles. Sure, you try to rein it back in with custom markers and overlays, but at the root, the core component—the map itself—is out of your hands.
Because it’s so easy to put in Google Maps instead of make your own (although it is getting a little easier), everything starts to look and feel the same and we get stuck in this Google Maps-confined interaction funk. Don’t get me wrong. Google Maps does have its uses and it is a great application. I look up directions with it all the time, but we should also keep in mind that there’s more to mapping than bubble markers all in the color of the Google flag.
Remember: a little bit of design goes a long way.
Data Visualization with Web Standards
Wilson provides a tutorial for horizontal bar charts and sparklines with nothing but HTML and CSS. Why would you want to do this when you could use some fancy graphing API? Using Everyblock as an example, data visualization can serve as part of a navigation system as opposed to a standalone graphic:
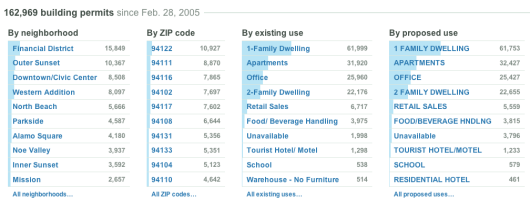
Sometimes the visualization isn’t at the center of attention.
Make sure you check out Everyblock, a site that is all about the data in your very own neighborhood, to see these maps and graphs in action.
[Thanks, Jodi]
 Visualize This: The FlowingData Guide to Design, Visualization, and Statistics (2nd Edition)
Wes Willet has a rather nice paper on enhancing navigation elements with extra data – “Scented Widgets: Improving Navigation Cues with Embedded Visualizations“
really cool. simple and very data intensive.