RJ Andrews held an exhibition of data graphics at 41 Cooper in New…
physical
Bringing data into the real world.
-
Data graphics off the screen
-
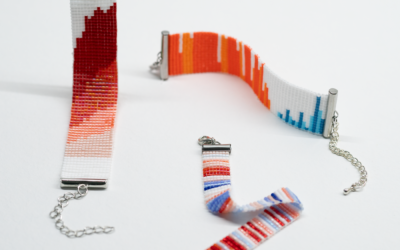
Data bead bracelets
Data Beads, by Eszter Katona and Mihály Minkó, is a fun initiative that…
-
See wind data on Mars through tele-present wind
With the art installation tele-present wind, David Bowen displays data collected by NASA’s Perseverance rover mission.
-
3-D print of John Snow cholera map
You know the John Snow map that highlights a cholera outbreak in London,…
-
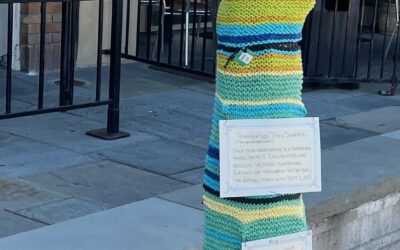
Tree blanket color-coded by local temperature
Speaking of data blankets, the knitting club in the area I live has…
-
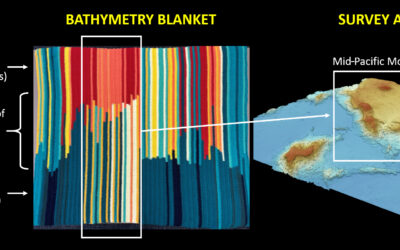
Bathymetry blanket crochet
Jesse Gwinn, from NOAA, was at sea on a mapping expedition and to…
-
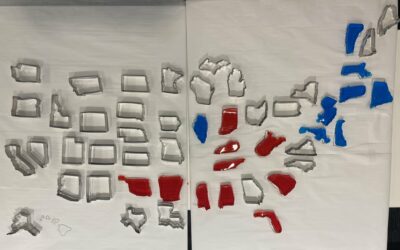
Jello map as states are called
The Bloomberg Graphics desk is building out a jello map as states are…
-
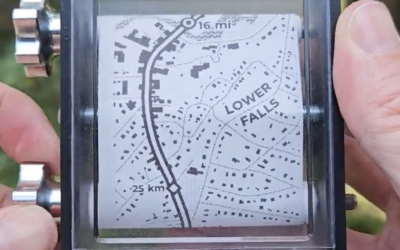
Scrolling map on receipt paper
Aaron Koelker printed a six-foot long map on receipt printer earlier this year.…
-
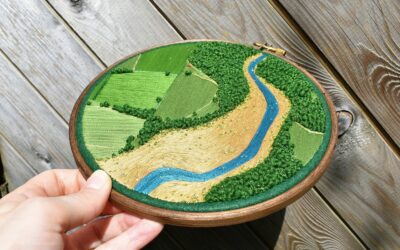
Embroidered landscapes
Victoria Rose Richards uses embroidery to depict aerial views and landscapes. The above…
-
Hockey player tracking projected on ice for live watch party
During the Dallas Stars away games during this year’s NHL playoffs, fans could…
-
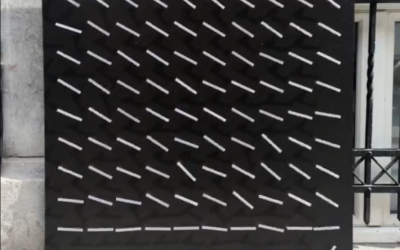
Wind flows displayed with spinning paddles
Joanie Lemercier used a grid of spinning paddles that turn with the wind.…
-
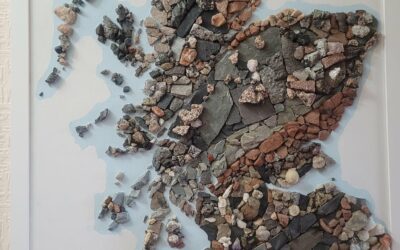
Rock map of Scotland
Harry Jefferies shared his grandfather’s 30-year project:
My grandpa who is 85 started… -
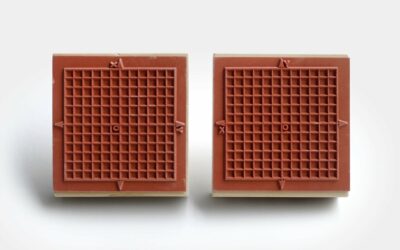
A rubber stamp for graph axes
For graphing on the go, Present & Correct offers a rubber stamp with…
-
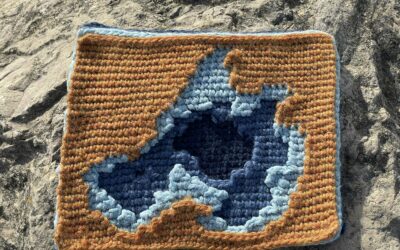
Crochet lake map
Andrew Hahn crocheted a map of Lake Mendota in Wisconsin. Each stitch represents…
-
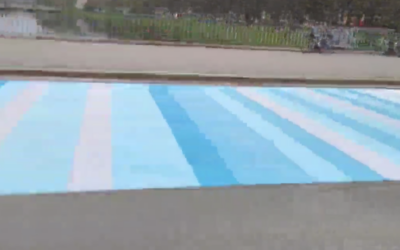
Global warming bike path
The @LpzfuersKlima team have completed painting a giant representation of the Warming Stripes…
-
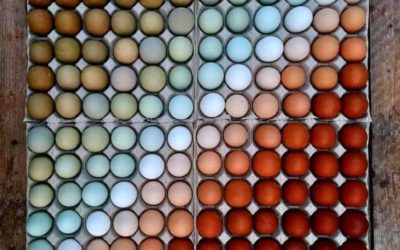
Chicken egg color spectrum
Eggs aren’t always white, which is oddly calming in this photo by way…
-
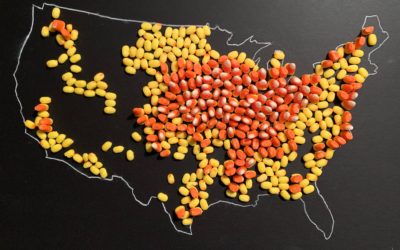
Map made of candy corn to show corn production
With candy corn as her medium, Jill Hubley mapped corn production in the…
-
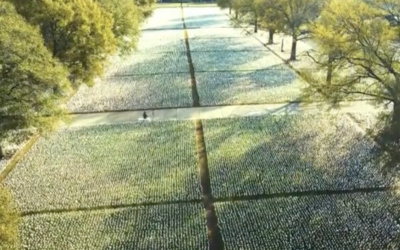
A flag planted for every Covid-19 death
In fall 2020, Suzanne Brennan Firstenberg planted a flag for each American who…
-
Data recorded in fabric quilt
Kim Moran-Jones quilted temperature minima and maxima in the UK, along with Covid-19…
-
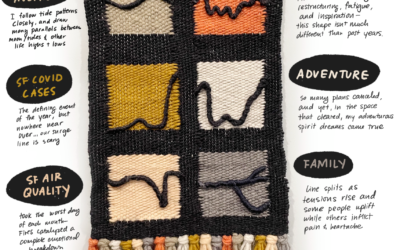
Tapestry for reflective data visualization
As a way to reflect on 2020, Catherine Madden wove tapestry to visualize…




 Visualize This: The FlowingData Guide to Design, Visualization, and Statistics (2nd Edition)


