[arve url=”https://www.youtube.com/watch?v=XmYNISBjL_Q” loop=”no” muted=”no” /]
Virtual reality puts you in a digital world…
physical
Bringing data into the real world.
-
Data visualization in virtual reality
-
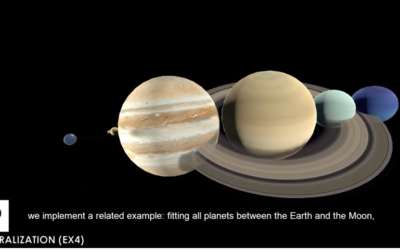
I am a book. I am a portal to the universe.
Stefanie Posavec and Miriam Quick have a new book out called I am…
-
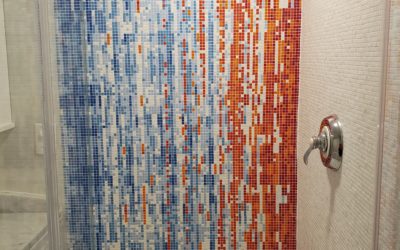
Climate change displayed, with shower tiles
Based on a chart by Ed Hawkins, the shower wall of Gretchen Goldman…
-
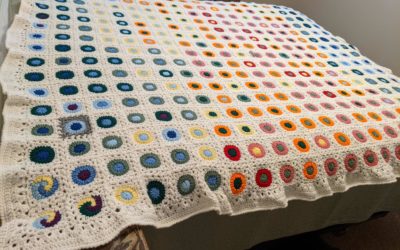
Blanket visualizes daily high and low temperatures
Reddit user quantum-kate used daily high and low temperatures in Denver in 1992…
-
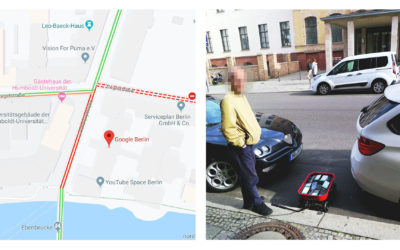
Faking traffic on Google Maps with a wagon of 99 smartphones
Google Maps incorporates data from smartphones to estimate traffic in any given location.…
-
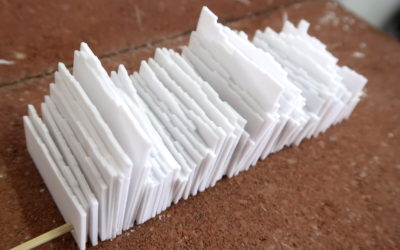
3-D-Printed Time Series Plates
After seeing a 1950s physical visualization, I wondered if I could follow a similar process using modern techniques.
-
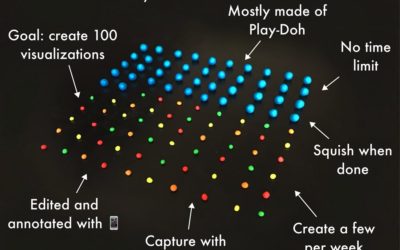
Visualizations using Play-Doh
We usually visualize data on computers, because it’s where the data exists and…
-
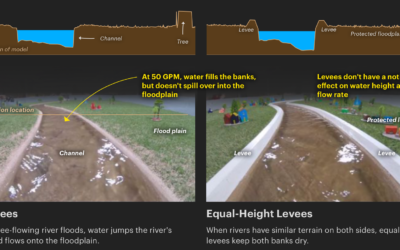
Scale model shows how levees increase flooding
Levees are intended to prevent flooding in the areas they are built, but…
-
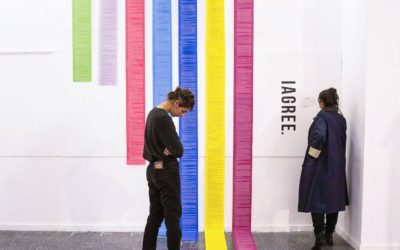
Comparison of terms and conditions lengths
Most of us don’t read the terms and conditions before we click on…
-
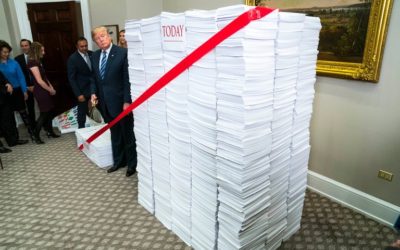
Regulations.
Doug Mills, reporting for The New York Times:
Echoing his days as a… -
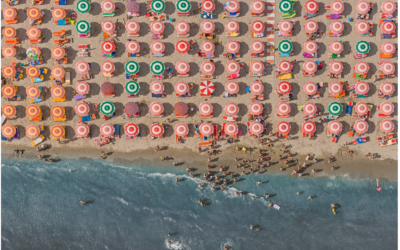
Looking for patterns and structures from the sky
Photographer Bernhard Lang takes pictures in small planes and helicopters, pointing his camera…
-
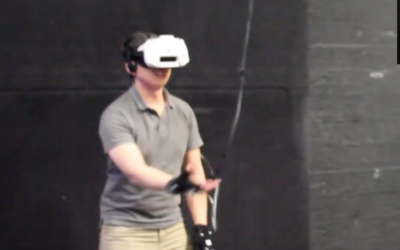
Catching a real ball in virtual reality
Man wears virtual reality headset. Another man throws a ball to headset-wearing man.…
-
Watch bacteria evolve resistance to antibiotic
Scientists at Harvard University setup the MEGA-plate, essentially a giant petri dish, with…
-
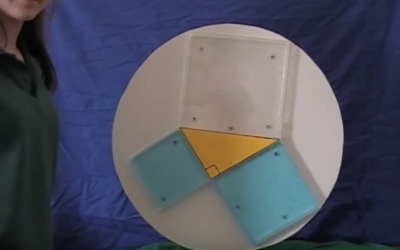
Pythagorean theorem water demo
This is years old, but it still tickles the neurons every time. It’s…
-
Fun in exchange for personal data
Sensible Data by Martin Hertig is an installation that asks what personal data…
-
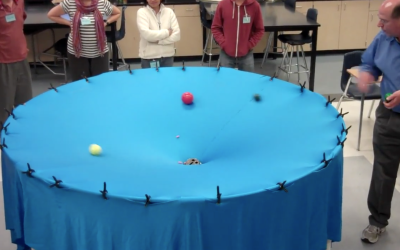
Gravity visualized in physics demo
Properties of time and space using marbles and two large pieces of spandex sewn together in a classroom demonstration.
-
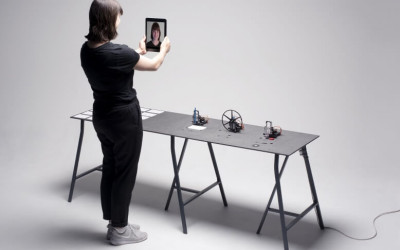
Turn a two-way mirror into an information display
Here’s a fun project to try over the weekend. Hannah Mitt and Andrew…
-
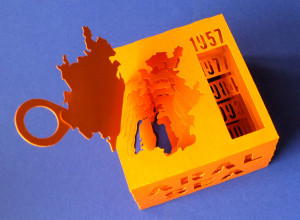
3-D paper model of a shrinking sea
The Aral Sea in Uzbekistan, formerly one of the largest lakes in the…
-
Entire English Wikipedia in physical print
The exhibit From Aaaaa! to ZZZap! opened last week with a hit of…
-
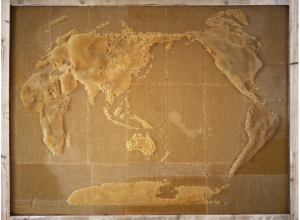
Getting bees to construct geographic maps
In an exploration of the connection between humans an nature, artist Ren Ri…




 Visualize This: The FlowingData Guide to Design, Visualization, and Statistics (2nd Edition)


