The New York Times mapped the slow, wide-reaching flood waters this year so…
New York Times
-
Sprawling flood waters across the Midwest and South
-
Stacking Apple apps in the App Store
For The New York Times, Jack Nicas and Keith Collins stack up app…
-
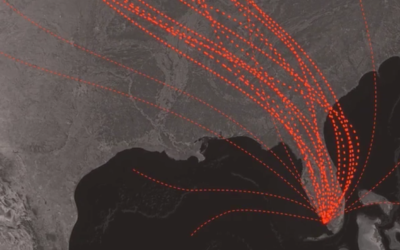
What that hurricane map means
For The New York Times, Alberto Cairo and Tala Schlossberg explain the cone…
-
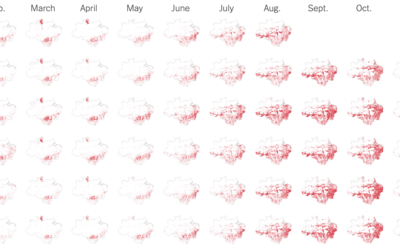
Detected fires in the Amazon rain forest, monthly
The New York Times goes with monthly small multiples to show detected fires…
-
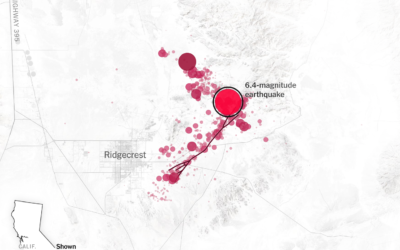
Earthquake trigger
For The New York Times, Derek Watkins used animated maps to show how…
-
Scale of the Hong Kong protest
You know those sped up videos where there’s a long line for something…
-
Home zoning in major cities
The single-family home. It’s part of the American dream, but it can be…
-
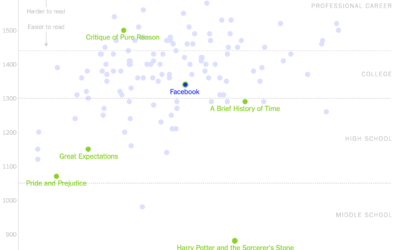
Readability of privacy policies for big tech companies
For The New York Times, Kevin Litman-Navarro plotted the length and readability of…
-
Rise of the summer sequel
For The New York Times, Keith Collins shows the growing popularity of summer…
-
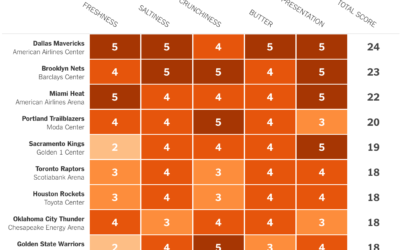
Stephen Curry scores every arena’s popcorn
I marked this article for later reading. It’s about Stephen Curry’s love of…
-
What happened at Notre-Dame
Notre-Dame in Paris, France was on fire. The New York Times describes what…
-
Facial recognition machine for $60
For The New York Times, Sahil Chinoy on privacy and how easy it…
-
Bad data from a faulty sensor on the Boeing 737 Max
The New York Times illustrated what likely happened in the Ethiopian Airlines and…
-
Internet under the sea
To connect servers around the world, there are actual cables that run under…
-
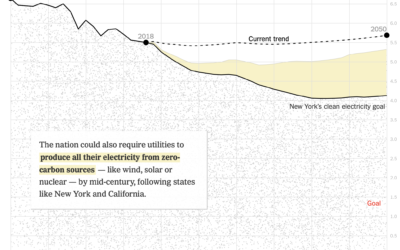
How fast emissions would reduce if other plans were adopted
The United States is doing pretty poorly in reducing emissions. For The New…
-
Opportunity rover’s path on Mars
After a most unforgiving dust storm on Mars, NASA ended the 14-year mission…
-
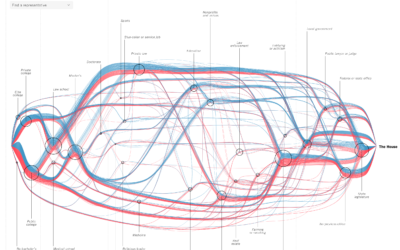
See every member’s path to the House of Representatives
For The New York Times, Sahil Chinoy and Jessia Ma visualized the path…
-
Amanda Cox promoted to New York Times data editor
Amanda Cox is the new data editor for The New York Times:
As… -
Government shutdown, other industries provided for scale
As the shutdown continues, 800,000 government workers wait for something to happen. The…
-
Border wall progress chart
Denise Lu for The New York Times provides a quick overview of the…











 Visualize This: The FlowingData Guide to Design, Visualization, and Statistics (2nd Edition)


