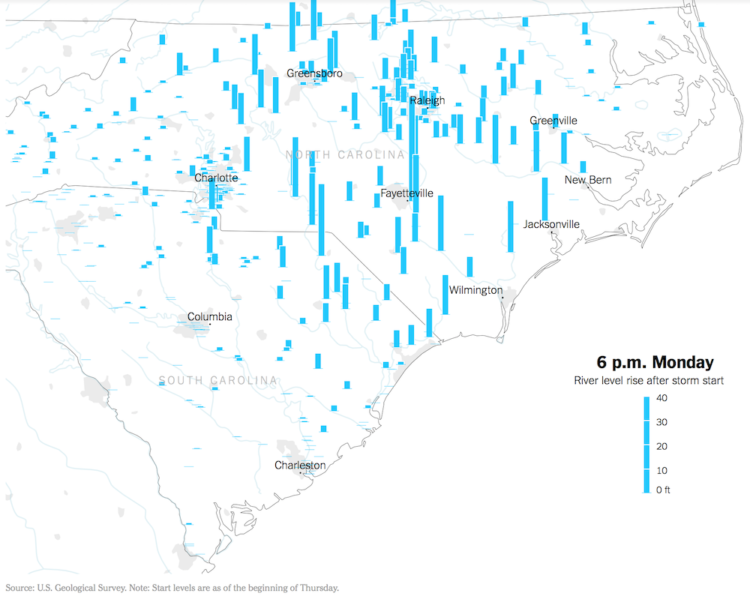
Hurricane Florence brought a lot of rain, which in turn made river levels rise. The New York Times animated the rise over a five-day period. The height of the bars represents the rise of the river level, as compared to levels on Thursday.
I like the visual metaphor of bars going up with river levels. I’m not sure the sudden rise and falls in such short periods of time would appear as surprising.
 Visualize This: The FlowingData Guide to Design, Visualization, and Statistics (2nd Edition)