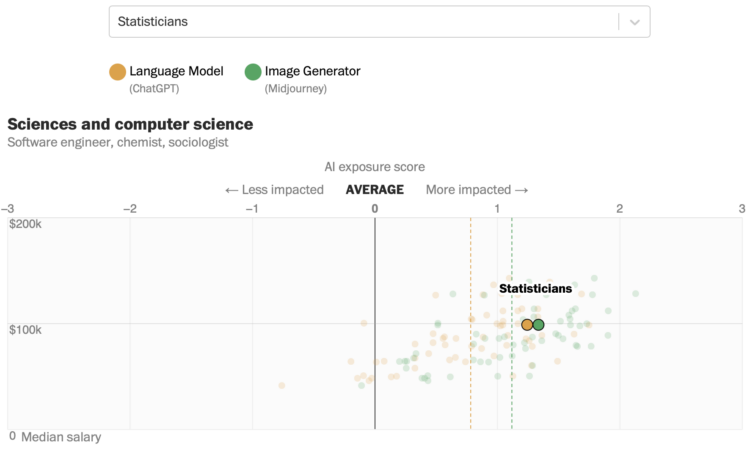
• Membership
  • Newsletter
  • Projects
  • Learning
  • About
  • Member Login
  • Visualization  /  best-of

    Best Data Visualization Projects of 2022

    Every year, I pick my favorite data visualization projects, which tend to cover a wide range of purposes but are typically for presentation. Here are my favorites for 2022.

    Read More
  • Southwest flight cancellations

    December 27, 2022

    Topic

    Statistical Visualization  /  CNN, flights, Southwest

    There were a lot of flight cancellations this week, but Southwest Airlines is on another level. This straightforward chart by Matt Stiles for CNN says it all.

  • Apply your daylight saving preferences to the rest of the country

    December 27, 2022

    Topic

    Maps  /  daylight saving, FiveThirtyEight

    We like to complain about changing time an hour back or forward, and usually it’s in the context of our own geography. Maybe one area gets a lot of later sunsets, but then another gets much less. FiveThirtyEight made a map that lets you put in your preference to see how the rest of the country is affected:

    Unfortunately, no solution will make every American happy. Even if you’ve found a combination that satisfies your personal preferences, you may have noticed that those preferences could negatively impact other parts of the country. And advocates for changing the system we currently have — whether for or against DST — feel strongly that their personal preference is the best.

    We all know the solution here. Everyone gets to sleep, wake, and work whenever they want. Easy.

  • Inevitably super rich

    December 23, 2022

    Topic

    Infographics  /  Alvin Chang, Pudding, rich, wealth, Yard-sale model

    Sometimes it feels like a foregone conclusion that most of the money ends up with a small percentage of people. Alvin Chang, for The Pudding, describes the Yard-sale model, which shows how such a skew in distribution inevitably happens even when an individual’s chances seems fair.

    This is a fun one. It’s got illustrations, simulations, and interaction to show you how the (simplified) model works and applies to your life.

  • Members Only

    Finding the Point

    December 22, 2022

    Topic

    The Process  /  meaning, purpose

    Visualization for the sake of visualization is a drag and fleeting. Find purpose for your work.

  • Lord of the Rings and Santa Venn diagram

    December 22, 2022

    Topic

    Infographics  /  humor, Kaitlyn Facista, Lord of the Rings, Santa

    Kaitlyn Facista, of Tea with Tolkien, made a four-part Venn diagram that shows the intersection between Gandalf, Dark Lord Sauron, and Tom Bombadil from Lord of the Rings and Santa Claus.

  • Visual exploration through emotional granularity

    December 21, 2022

    Topic

    Infographics  /  emotion, Pudding

    We often talk about emotions in more basic terms, such as disgust, joy, sadness, and anger, but of course it goes deeper than that. When talking to others, it helps to have the words to express these more complex feelings. Abby VanMuijen and Michelle McGhee, for The Pudding, take you on a tour of what it means to feel.

  • Carbon footprint in the city versus the suburbs

    December 20, 2022

    Topic

    Maps  /  carbon, New York Times, pollution

    Bringing it down the Census tract level, Nadja Popovich, Mira Rojanasakul and Brad Plumer, for The New York Times, mapped emission estimates so you can see the impact of your neighborhood:

    A map of emissions linked to the way people consume goods and services offers a different way to view what’s driving global warming. Usually, greenhouse gases are measured at the source: power plants burning natural gas or coal, cows belching methane or cars and trucks burning gasoline. But a consumption-based analysis assigns those emissions to the households that are ultimately responsible for them: the people who use electricity, drive cars, eat food and buy goods.

    The estimates are based on research from the University of California, Berkeley.

    We often think of big cities as dirtier and more pollution-heavy. By absolute counts, because there are more people, this is a correct statement, but from a per household point of view, the contrast is flipped.

  • VIS 2022 talks are online

    December 20, 2022

    Topic

    Statistical Visualization  /  conference, talks

    With the holidays just about here, I’m sure there’s nothing you’d rather do more than listen to hours of visualization research talks from VIS 2022. Lucky for you: all the talks are online.

    Just sit back, relax, and let the knowledge wash over you.

  • xkcd on optimal bowling metrics

    December 19, 2022

    Topic

    Statistical Visualization  /  bowling, humor, xkcd

    xkcd charted optimal bowling in terms of aim, speed, spin, and weight. This is very important.

  • Stable Diffusion to generate spectrograms to convert to sounds

    December 16, 2022

    Topic

    Statistics  /  AI, music, spectrogram, Stable Diffusion

    Stable Diffusion is an AI model that lets you enter text to generate images. Spectrograms visually represent sound. Seth Forsgren and Hayk Martiros combined the two for Riffusion, which lets you enter text and the model generates a spectrogram that is converted to audio.

    Read more about the process here.

  • Members Only

    Mistaken Error

    December 15, 2022

    Topic

    The Process  /  error, mistake

    That can’t be for real, right? Right? A basic chart is not quite what it seems.

  • One home’s blackouts in Kyiv

    December 15, 2022

    Topic

    Self-surveillance  /  blackout, electricity, Ukraine, Volodymyr Agafonkin

    Volodymyr Agafonkin and his family live in Kyiv, Ukraine. He visualized when the power went out over the past two months:

    As you can see, we spend 4–8 hours in blackout during a typical day. You can notice some stepping patterns in the data — this is our energy workers trying to stabilize the blackouts into some kind of schedule, although it’s often overridden due to emergency shutdowns. More blackouts happen in the evening time because of the increased load on the grid, with everyone getting home after work and cooking dinner. There’s usually no need for blackouts at night because people go to sleep, and the load falls sharply — that’s usually the time for us to charge devices, turn on the washing machine & dishwasher, and occasionally bake something nice in the oven.

  • Conway’s Game of Life in infinite space

    December 14, 2022

    Topic

    Data Art  /  Game of Life, infinite, saharan

    Conway’s Game of Life is a zero-person game where cells in a grid live or die based on a simple set of rules. You set the initial state and the cells change accordingly. Life Universe by saharan is an infinite game of life where you can zoom in and out recursively. Trippy.

  • Bodybuilder risks

    December 13, 2022

    Topic

    Infographics  /  body, muscle, risk, steroids, Washington Post

    The human body has its limits, so many bodybuilders take steroids to increase those limits to build bigger muscles. Bonnie Berkowitz and William Neff, for The Washington Post, used a combination of illustration and 3-D animations to show what happens and the risks of introducing more of everything to the body.

  • Information Graphic Visionaries delivered

    December 12, 2022

    Topic

    Visualization  /  book, history

    Visualization still seems like a relatively new thing, but it has a history that goes back a few centuries. The Information Graphic Visionaries book series celebrates this history with a profile of three makers — Florence Nightingale, Emma Willard, and Étienne-Jules Marey — and their work.

    The series started as a Kickstarter campaign and the books have been making their way out. I just got my copy on Marey and the graphic method. I’m looking forward to digging in.

  • Gifts my true love gave to me over the 12 days of Christmas

    December 9, 2022

    Topic

    Statistical Visualization  /  humor, song

    From Reddit user neilrkaye. This is very important.

  • Perfect seasons needed to get over .500 overall

    December 9, 2022

    Topic

    Statistical Visualization  /  record, sports, Washington Post, wins

    Here’s a fun one from Philip Bump for The Washington Post. Bump simply asks how many wins it would take for sports franchises to reach a .500 record over the life of the franchise. The historically bad teams bubble to the top.

  • Members Only

    Scratching Projects

    December 8, 2022

    Topic

    The Process  /  scratch

    Sometimes it’s not worth finishing what you start.

  • Life cycle of coronavirus at the molecular level

    December 8, 2022

    Topic

    Infographics  /  coronavirus, Maastricht University

    [arve url=”https://www.youtube.com/watch?v=tDsHUHrEuRM” /]

    From Maastricht University:

    What happens if a SARS-CoV-2 coronavirus enters your lung? This molecular animation visualises how the virus particle can take over the host cell and turns it into a virus factory. Eventually, the host cell produces so many viral particles that it dies and releases numerous new virus particles.

    Aw, such a cute little, life-altering virus. [via kottke]

  • Page 49 of 391
  • <
  • 1
  • ...
  • 46
  • 47
  • 48
  • 49
  • 50
  • 51
  • ...
  • 391
  • >

Analyze, visualize, and communicate data usefully, beyond the defaults.

Become a member →

Recently for Members

May 8, 2025
When the data is not what it seems

May 1, 2025
Finding the Right Charts

April 24, 2025
Visualization Tools, Datasets, and Resources – April 2025 Roundup

April 17, 2025
Breaking Out of Chart Software Defaults

April 15, 2025
Line Chart with Decorative Neon Accents

Browse by Chart Type See All →

Chord Diagram Network Graph Calendar Parallel Coordinates Mosaic Plot Horizon Graph Pictogram Grid Map Surface Plot Choropleth Map

Browse By Topic

  • Visualization

    Seeing data

  • Maps

    Seeing geographic data

  • Infographics

    Explaining data

  • Networks

    Connecting data

  • Statistics

    Analyzing data

  • Software

    Working with data

  • Sources

    Getting data

  • Design

    Making data readable

Get the Book

Visualize This: The FlowingData Guide to Design, Visualization, and Statistics

Available now.

Order: Amazon / Bookshop

Made by FlowingData

  • The Process

  • Data Underload

  • Chart Everything

  • Guides

  • Books

  • Shop

  • About
  • Contact
  • Newsletter
  • LinkedIn
  • Instagram
  • Bluesky
  • RSS
Copyright © 2007-Present FlowingData. All rights reserved.