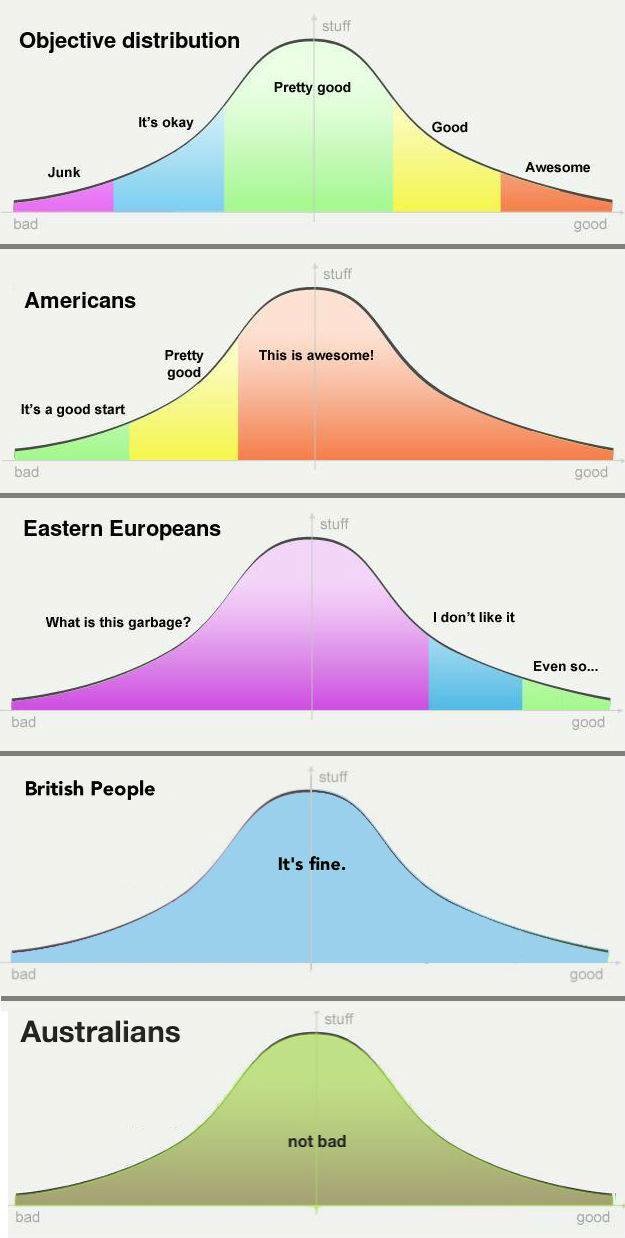
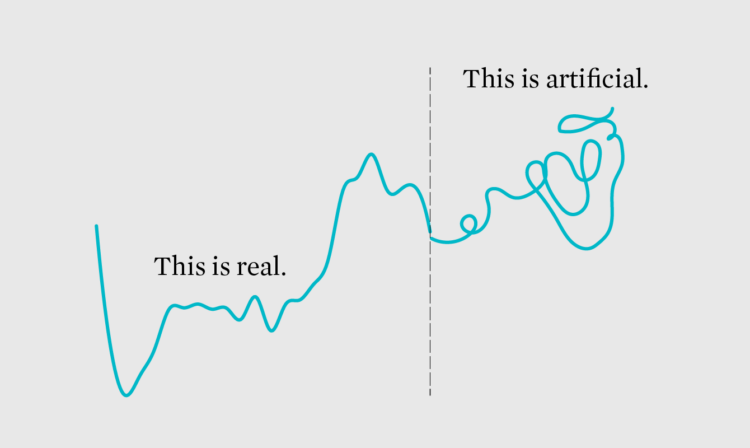
Putting this joke chart up for posterity, because it deserves it. The earliest version of this chart I could find was from 2019, but I’m almost certain it’s older than that. Please let me know if you know where the original is from.
Putting this joke chart up for posterity, because it deserves it. The earliest version of this chart I could find was from 2019, but I’m almost certain it’s older than that. Please let me know if you know where the original is from.
Speaking of non-location in the seas, researchers at the University of California at Santa Cruz, NOAA Fisheries, and Global Fishing Watch are trying to use the absence of data to identify boats fishing illegally. Harry Stevens for The Washington Post has the maps showing when fishermen turned off their transponders to hide location.
There’s plenty of (missing) data, but the tricky part is figuring out if the shutoffs are during illegal activities or are just fishermen keeping their spots private from competitors and pirates. [Thanks, Michael]
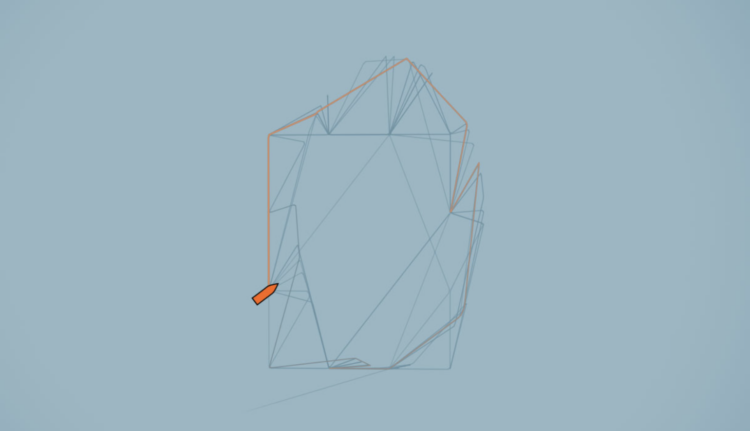
The New York Times tracked oil tankers faking their location as they ignore sanctions but keep insurance that is contingent on following the sanctions:
“It’s significant when you look at dollar terms,” said Samir Madani, co-founder of TankerTrackers.com, which monitors global shipping, who first alerted The Times to several of the suspicious ships. “It’s around $1 billion worth of oil that is going under the radar while using Western insurance, and they’re using spoofing in order to preserve their Western insurance.”
The transition from fake data to satellite image reality is slick.
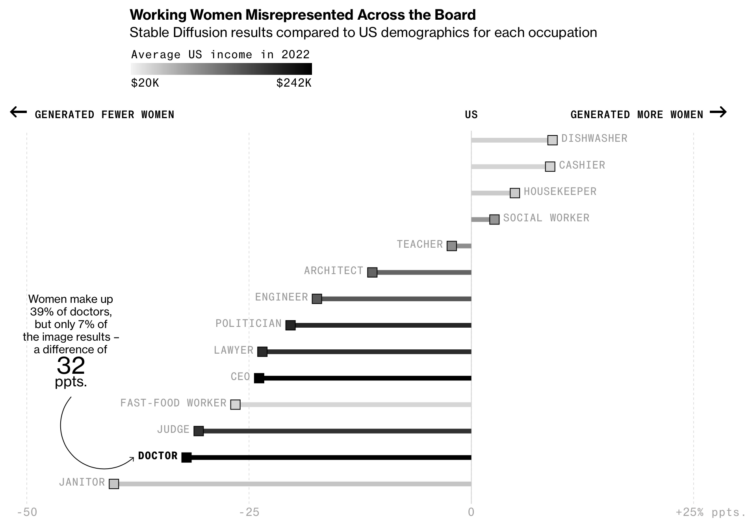
Perhaps to no one’s surprise, generative artificial intelligence models contain bias rooted in the data that drive them and by the people who design the systems. For Bloomberg, Leonardo Nicoletti and Dina Bass examined the extent to which the bias exists through the lens of Stable Diffusion.
Most of the piece is a rundown of what Stable Diffusion shows, but the biggest tell is the chart that compares the generated images against reality.
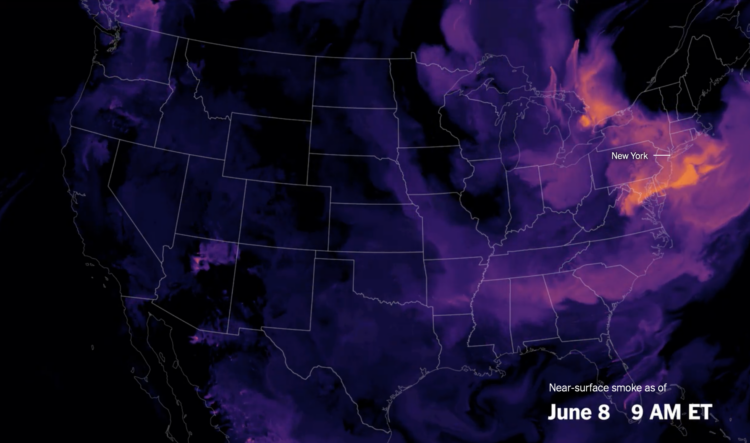
Wildfires in one area means smoke and pollution travels to surrounding areas, even thousands of miles away. For NYT’s The Upshot, Aatish Bhatia, Josh Katz, and Margot Sanger-Katz have the maps and charts that show how smoke traveled from the wildfires in Quebec, Canada.
Just thinking out loud about when the robot overlords will come for the analysis and visualization jobs.
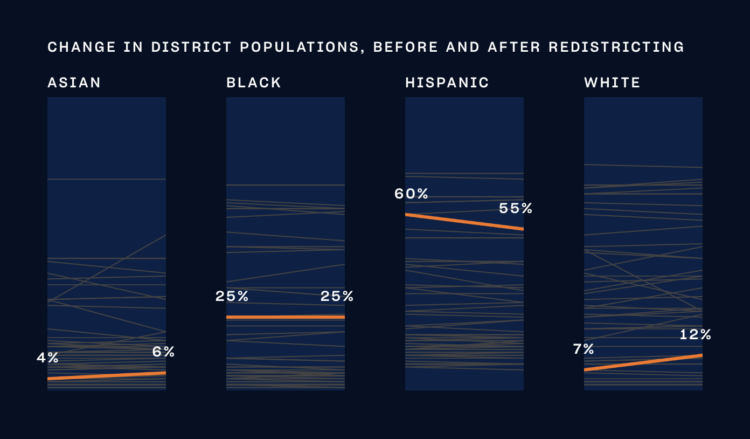
With New York 2023 elections coming up, The City and NY1 put together a straightforward guide for information and voting history for each district. I want something like this for my area, a vast improvement over the paper mailers that can be difficult to navigate. [Thanks, Scott]
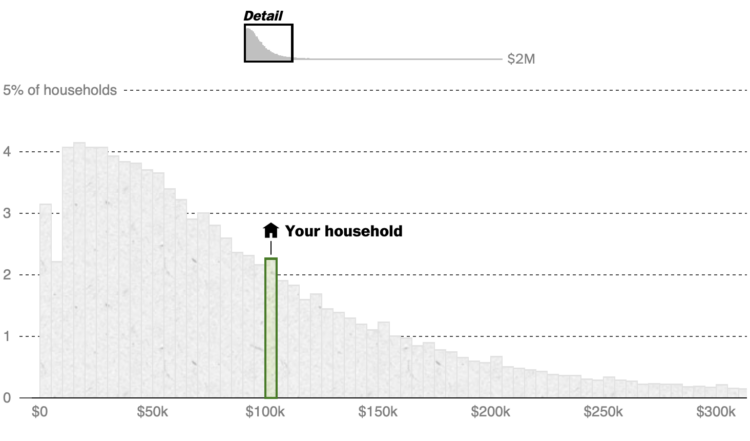
What counts as middle class depends on who and where you’re asking. Even if two households, say a single-person household in Montana and a five-person in California, earn the same income, the latter probably has more expenses than the former. The Washington Post broke it down with various comparisons. Enter a ZIP Code to see where you are.
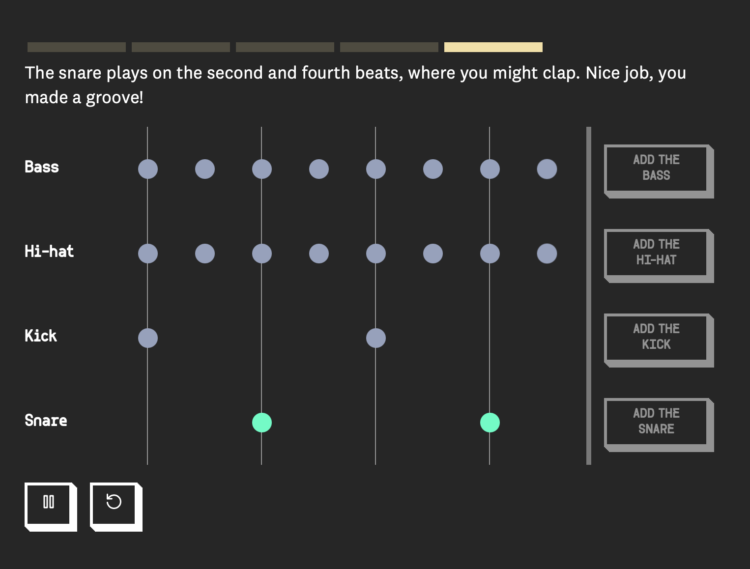
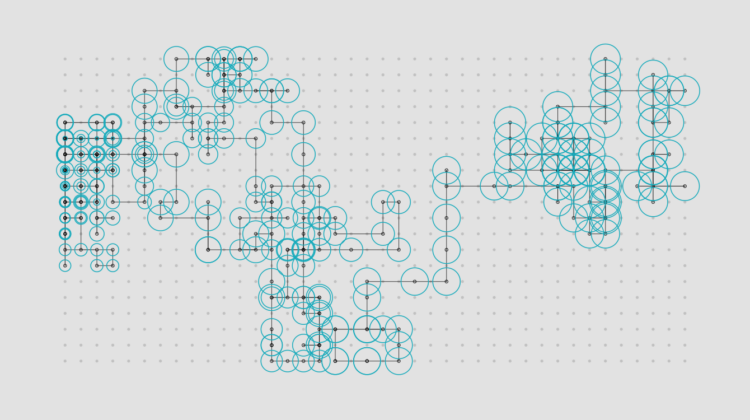
When you first learn to play music, a lot of the instruction is about structure. Turn the metronome on and follow the beats straight up. James Dewitt Yancey, also known as J Dilla, shifted the beats for a different feel and sound. This piece, by Michelle McGhee for The Pudding, demonstrates this difference.
Turn the sound on and press the buttons. It’s neat to hear the breakdown of the rhythm as you walk through the styles.
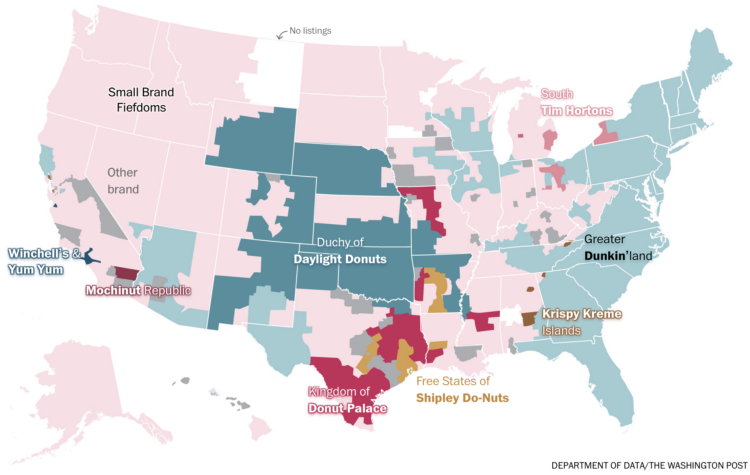
In a fun one by Alyssa Fowers, for The Washington Post’s Department of Data, a map of the most common donut shops in the United States:
We kicked off our investigation with our friends at Yelp, who shared all the doughnut shop listings on the review site. By grouping stores with the same name and calculating the most common doughnut shop in groups of census tracts around the country, we found that our reader’s observation was right on: The United States is a federation of at least nine distinct doughnut nations.
All hail Small Brand Fiefdoms.
Katherine Sayre, for The Wall Street Journal, on Las Vegas casinos squeezing out more juice:
Gambling companies such as MGM Resorts and Caesars, the two biggest operators on the Strip, have reduced how much they will pay for winning hands at blackjack at many of their tables, data show.
Blackjack, a fast-paced card game, historically paid out a ratio of 3:2 when a player hit 21 on the first two cards. That means a gambler wins $15 for every $10 bet. Now, many blackjack tables on the Strip pay out at 6:5, which means that same $10 yields only $12.
During my very first advanced probability course in college, the professor went right into the math of “the house always wins.” It only takes a tiny house advantage to guarantee you lose all your money over a long enough period of time.
For example, it would seem that if you play Blackjack following the same strategy as the dealer, the odds of you winning and losing would be even. But the dealer will always take your money if you bust, regardless of what hand they get. That’s enough advantage for the casino. Well, it was enough, until they started paying out less and increasing minimum bets.
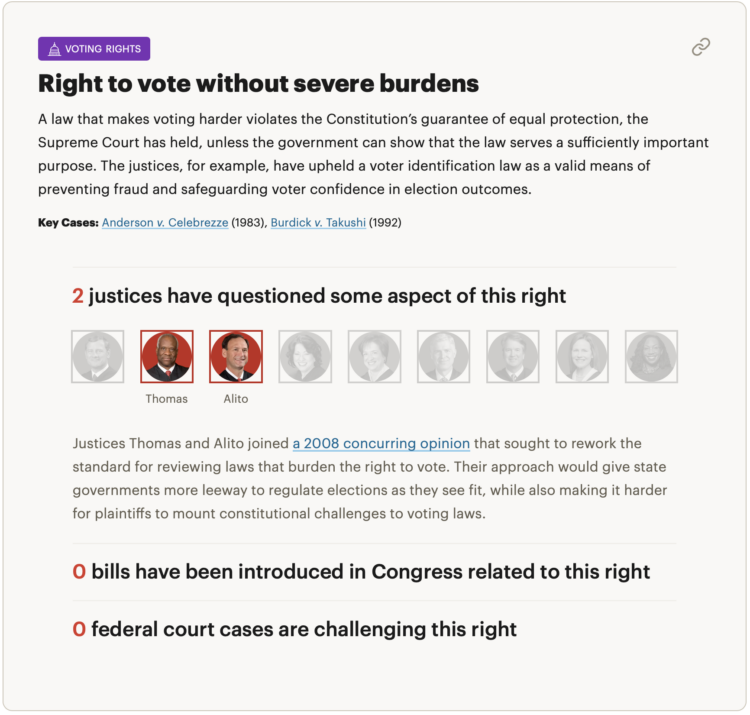
For ProPublica, Ian MacDougall and Sergio Hernandez evaluated records of sitting justices to gauge the rights at risk of being taken away. Each right gets a section with background, bills and court cases challenging the right, and the justices that have questioned the right through judicial opinions and public remarks.
In an effort to provide a more transparent process in visualization and interaction research, The Journal of Visualization and Interaction begins:
The Journal of Visualization and Interaction (JoVI) is a venue for publishing scholarly work related to the fields of visualization and human-computer interaction. Contributions to the journal include research in:
- how people understand and interact with information and technology,
- innovations in interaction techniques, interactive systems, or tools,
- systematic literature reviews,
- replication studies or reinterpretations of existing work,
- research software packages for HCI and visualization,
- and commentary on existing publications.
Cross-disciplinary work from other fields such as statistics or psychology, which is relevant to the fields of visualization or human-computer interaction is also welcome.
Focus on the small visualization things you can improve while still getting your work done.
To better understand the scale of time and feed your existential dread, Wylie Overstreet and Alex Gorosh used LED lights spread miles across a desert, proportional to milestones in the history of the universe. The model stretched 4.3 miles to represent 13.8 trillion years.
See also the seven-mile scale model of the Solar System, which is another video in their To Scale series. [via kottke]
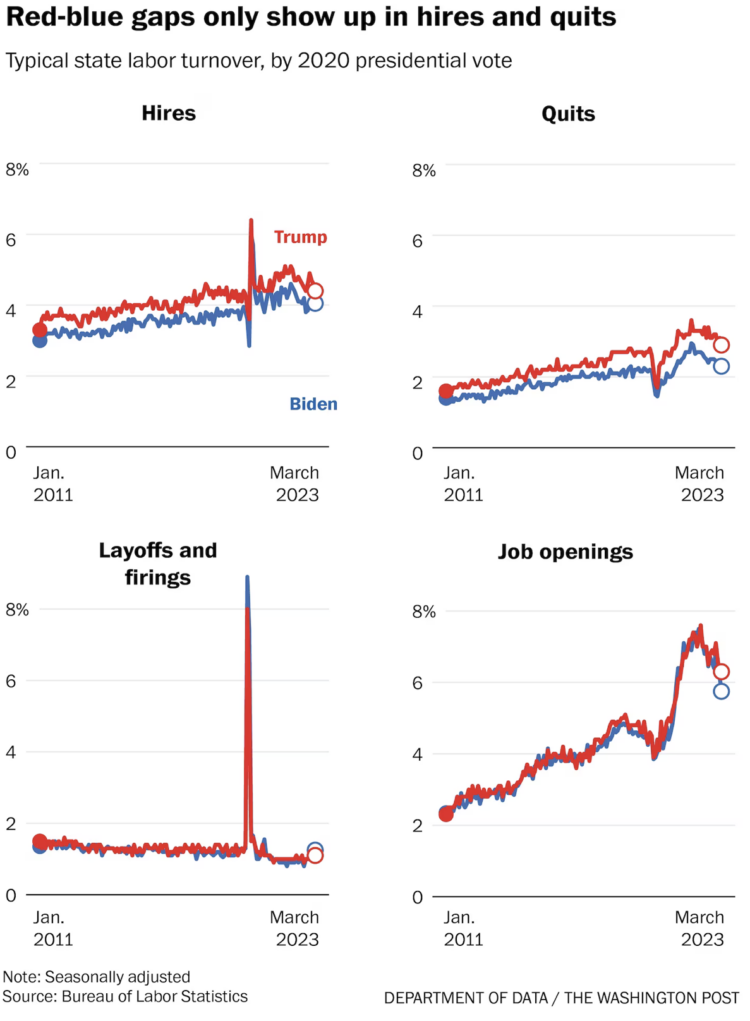
This is a good example of things are not quite what they seem until you look at more data. Andrew Van Dam, for Washington Post’s Department of Data, looks into why it appears red states hire more than blue states.
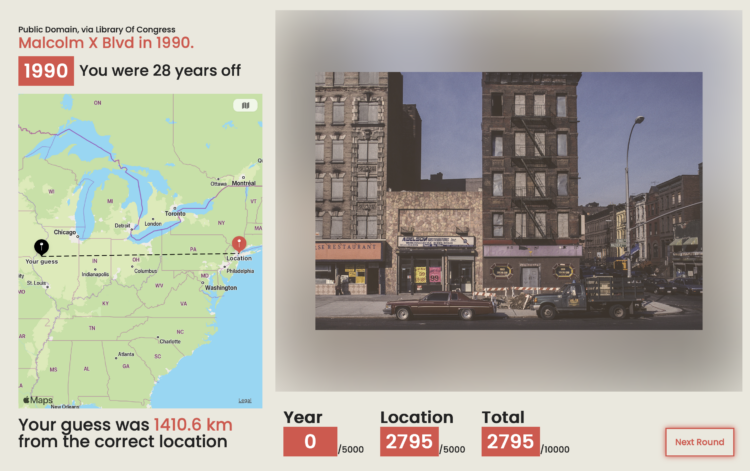
Add another geolocation guessing game that I am terrible at. TimeGuessr shows you a photograph, and you guess when and where it was taken.
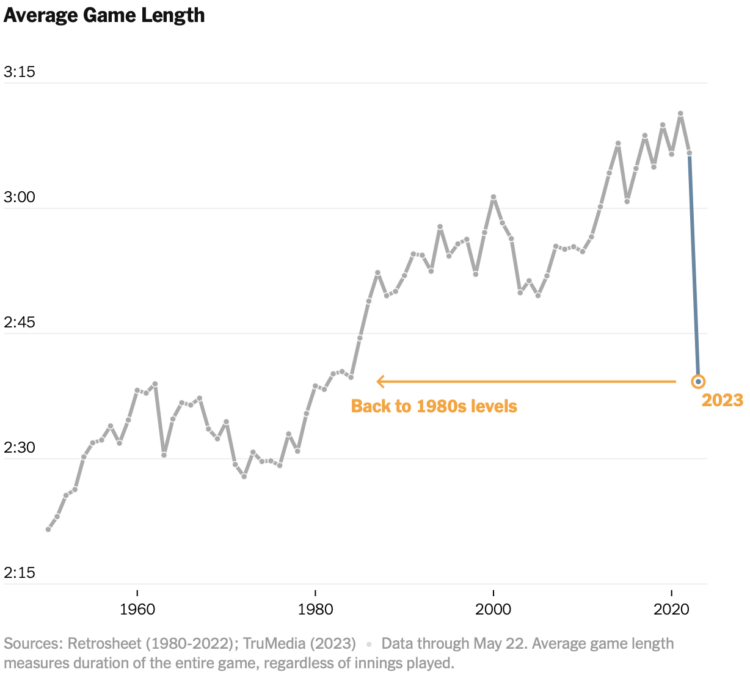
Baseball games grew longer over the decades, with the average length well over three hours in recent years. Ben Blatt and Francesca Paris, for NYT’s The Upshot, show how a few rule changes this season keep the ball moving for shorter games.
The Programme for International Student Assessment (PISA), run by the OECD since 2000, surveys teenage students to estimate the quality of education around the world. One of the questions asked: “What kind of job do you expect to have when you are about 30 years old?” For Vox, Alvin Chang walks through how the responses changed over the past two decades, which appears to suggest that students are less certain about what the future holds.
There are some tricky spots in explaining misalignment between ambition and preparation, but Chang does a good job of moving along step-by-step.
Here’s the good stuff for May.
 Visualize This: The FlowingData Guide to Design, Visualization, and Statistics (2nd Edition)
New tools, refined process.


