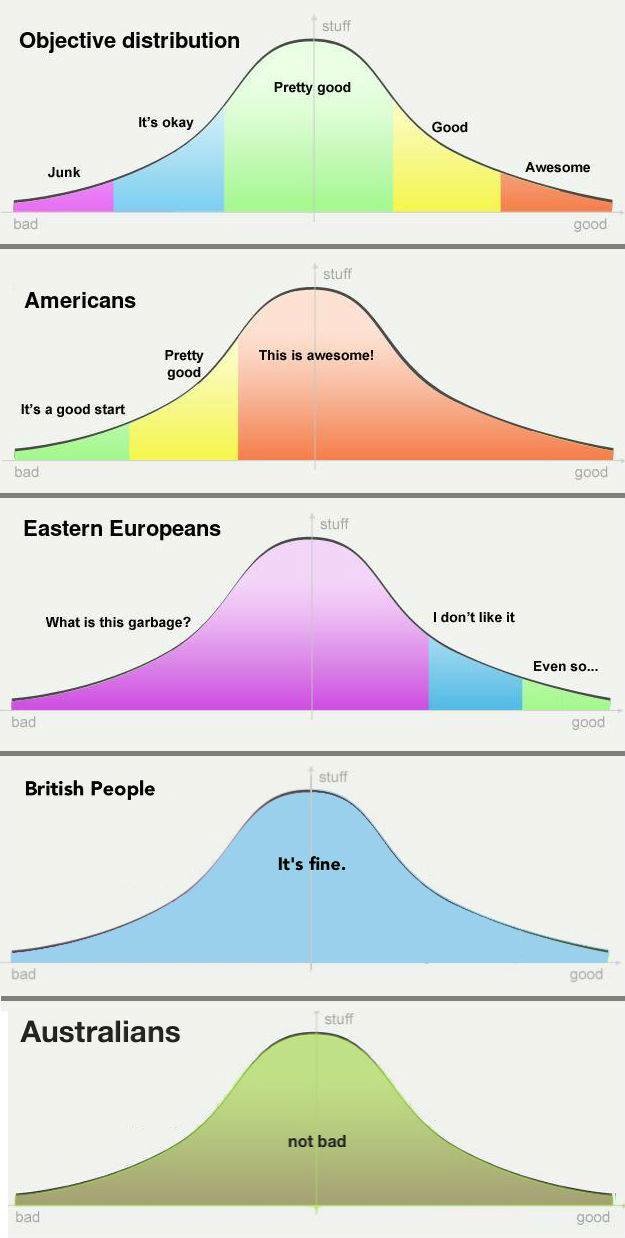
Putting this joke chart up for posterity, because it deserves it. The earliest version of this chart I could find was from 2019, but I’m almost certain it’s older than that. Please let me know if you know where the original is from.
Objectiveness distributions
Second Edition
 Visualize This: The FlowingData Guide to Design, Visualization, and Statistics (2nd Edition)
 Visualize This: The FlowingData Guide to Design, Visualization, and Statistics (2nd Edition)
New tools, refined process.