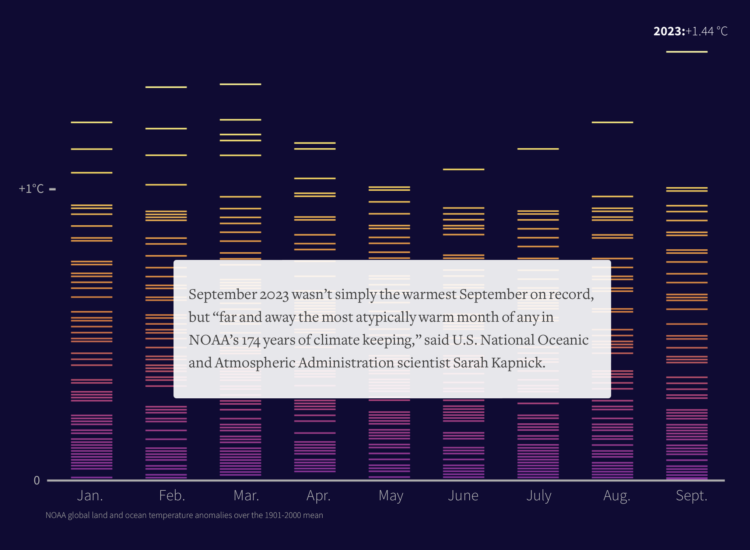
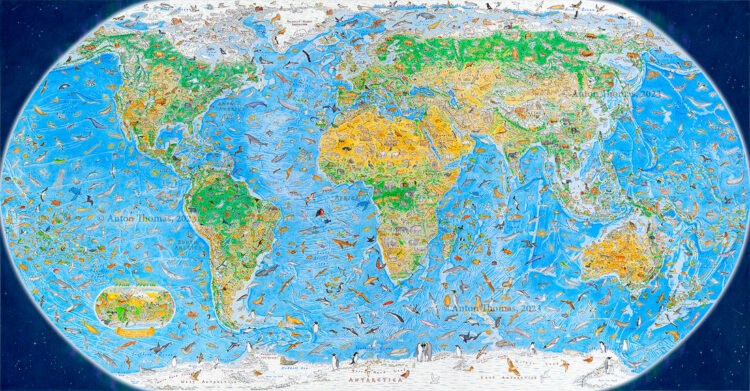
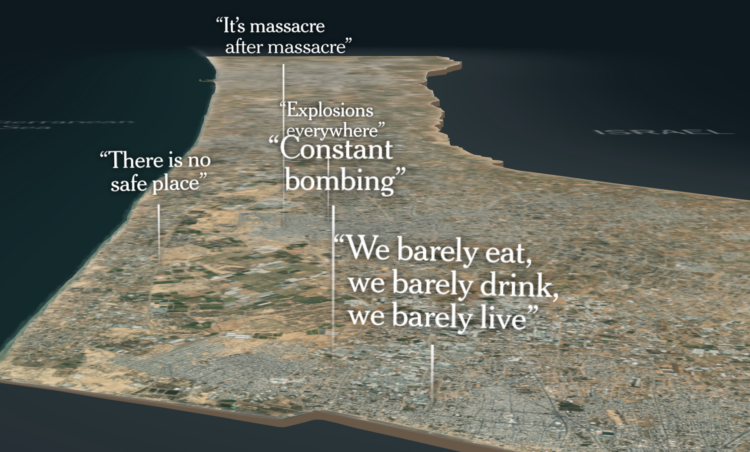
This year, 2023, was the hottest year on record. For Reuters, Gloria Dickie, Travis Hartman and Clare Trainor highlight the rising temperatures and the bad stuff that follows.
This year’s added warming has been like pouring gasoline on a fire. Extremes became more extreme. Warmer ocean waters fed stronger storms. Heatwaves persisted for weeks instead of days. And wildfires, feeding on dry forests and high temperatures, burned out of control.
An El Nino climate pattern, which emerged in the Eastern Pacific in June, is making things worse, scientists said. It’s boosting the warming caused by climate change, unleashing more catastrophic extremes.
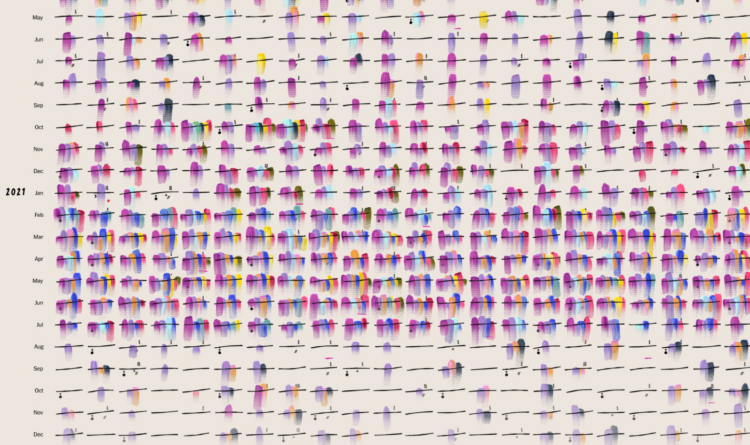
Temperature extremes are still worth highlighting, but there are only so many ways to show an increase over and over again. Maybe someone can make a global warming exhibit that starts at the temperature highs of the 1800s and very quickly increases temperature to current highs. Throw in some VR with storms and wildfires.
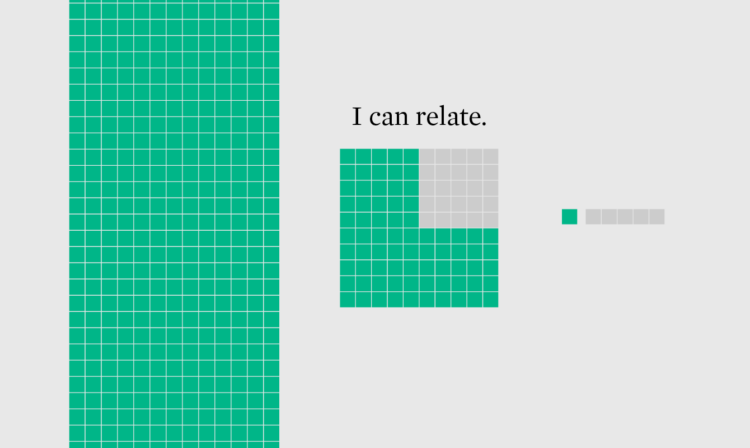

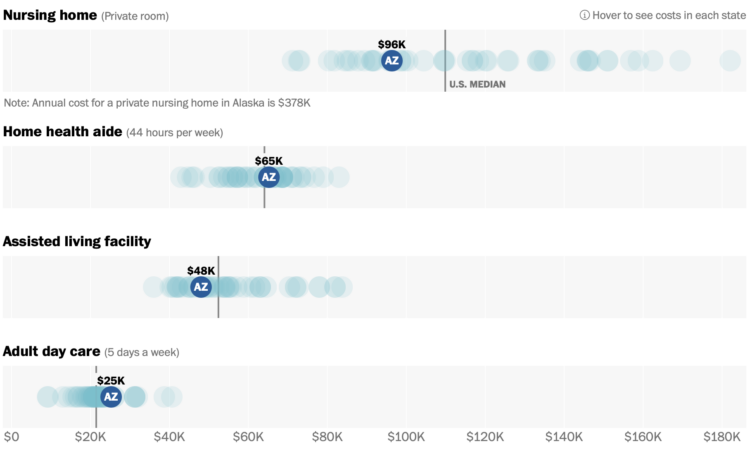


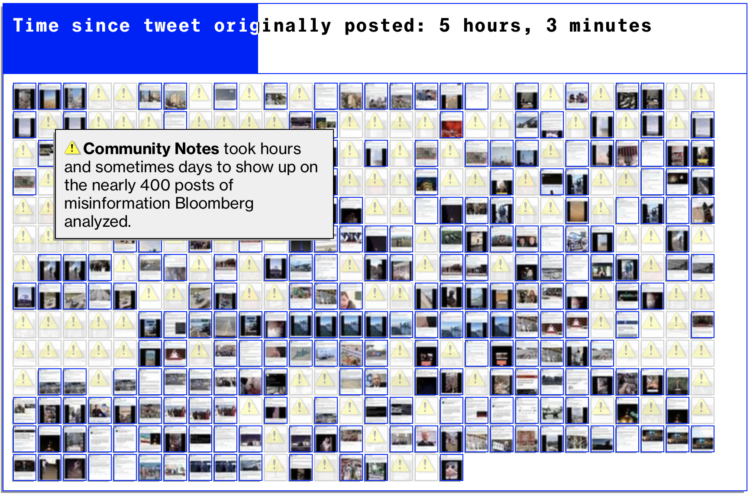
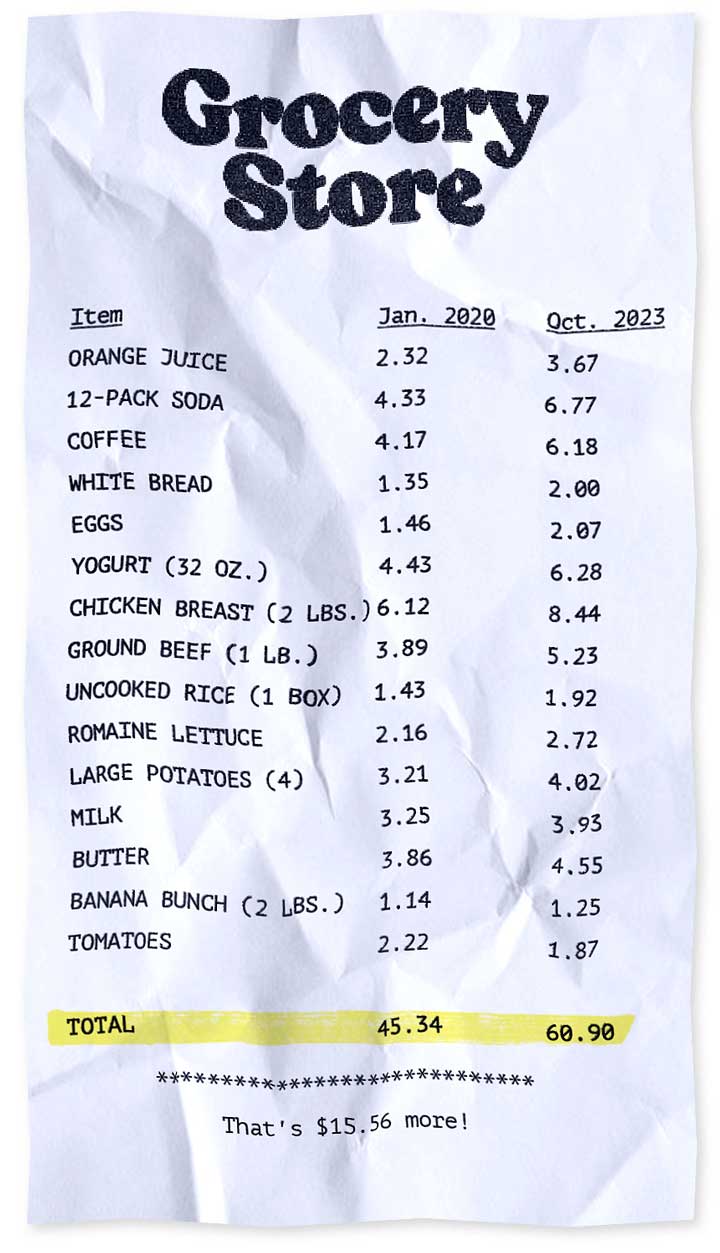 Usually inflation is more of a slow thing that you don’t notice so much until you think back to the time when a burger was only a dollar. Prices increased much faster over the past few years though. For Bloomberg, Reade Pickert and Jennah Haque zoom in on
 Visualize This: The FlowingData Guide to Design, Visualization, and Statistics (2nd Edition)


