As you might have noticed, I haven’t been live blogging the Data Viz VI conference here in Bremen. I arrived Tuesday evening and on Wednesday, the first day of the conference, I woke up at 9:00am (which is midnight PDT), and my body said, “Nathan, I hate you. Go back to bed.” I said no, and now I’m being punished. That’s pretty much how it’s been.
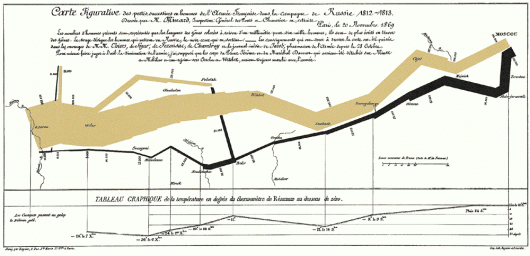
The actual conference, however, has been really interesting. Di Cook demoed GGobi via high school dropout salary data; Michael Friendly gave a nice talk on the golden age of statistical graphics; Gennady Andrienko talked a bit on clustering spatio-temporal data; and there have been plenty of other interesting ones in the mix. One criticism – Minard’s map, showing the march of Napoleon, has been mentioned at least five times. Enough already.
My Talk
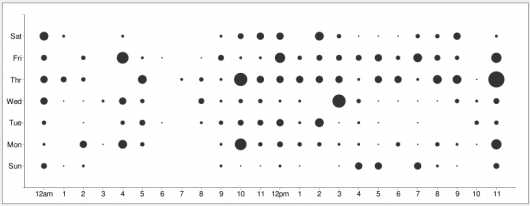
 I gave my talk on visualization for self-surveillance. I felt slightly off-topic talking more on design than on traditional statistical visualization, but no one threw any tomatoes at me, so that’s okay. The emphasis was on collecting data about ourselves, looking for patterns, and gaining some insight on the way we live with my current project as the case in point.
Animation in R
Yesterday, Andreas Buja got the audience’s attention by using R for animation. He used R to show fishing boat activity off the Pacific coast simply using getGraphicsEvent(). The coding syntax was very similar to Actionscript where there is a listener, and when an event fires off, a function is called. For example, you can tell R to do something when the user clicks on the mouse. The animated map amazed a lot of people. I was mildly amused.
Design and Statistics
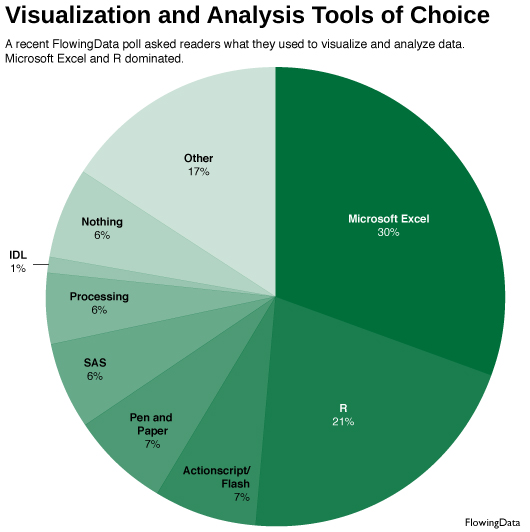
I’ve always known about the big divide between statistics and design for data visualization, but I didn’t really know how big the gap was until now. For example, Processing, which is the default tool for a lot of designers, is foreign to statisticians. At the same time, most designers have never touched or heard of R. From where I sit, I see two separate worlds trying to do the same thing – tell stories with data. Both sides have much to learn from the other. They just don’t know it yet.
This is not to say that the two haven’t done great things separately, because they have. But the potential is high when they merge. Throw computer science in there, which has found it way into seemingly everything as a necessity, and you’ve got something good on its way.

 With the unveiling of the brand new
 Technicians are all about implementation. They have a strong programming background with experience in
 Data is priority to analyzers. Like technicians, aesthetics are not the greatest concern; rather, analyzers want to know the relationships between variables, find positive and negative trends, and are most likely to tell you that you should have used a different type of graph or chart for that dataset. Tools like
 Artists are obsessed with the final product – what the visualization will finally look like. They are the designers who are most likely to think long and hard about colors, visual indicators, and whether or not that square box should be moved up 2 pixels to the left. Programming is not a strong point, but if it is, it’s most likely in Processing. The weapon of choice though is the
 The outsider is the one with a complex data set but not quite sure what to do with it. Outsiders are the field experts who want to visualize their data but might not have the know-how to follow through. They can, however, provide
 Light bulbs are the idea people. They’ve got some programming, design, and analytical experience, but they’re not necessarily experts in all three areas. Because of all the experience, the brighter bulbs can usually handle a large data visualization project on their own (if they had the time). Knowing what’s possible and not possible, light bulbs lead projects and can delegate work across a team. It’s all about the big picture for the bulbs while the brightest are like the zen masters of data visualization.
 Cory Doctorow from The Guardian writes about our
 Visualize This: The FlowingData Guide to Design, Visualization, and Statistics (2nd Edition)