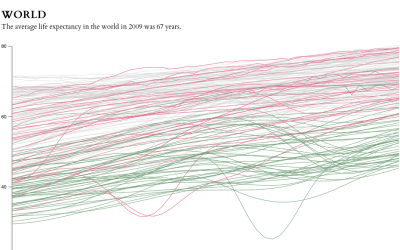
10 Largest Data Breaches Since 2000 – Millions Affected

In light of the MySpace photo breach (due to their negligence) a couple of months ago, I got to wondering about other recent data breaches. It turns out Attrition.org keeps a Data Loss Archive and Database that contains known data breaches since 2000. Records include date, number affected, groups involved, summaries, and links to reported stories and updates. It’s surprisingly detailed and even better, it’s all available for download.
The above graphic shows the 10 largest data breaches which affected millions. I thought the 800,000 records thieved from UCLA a couple of years ago (that my information was unfortunately a part of) was a lot. That’s nothing compared to these.
Notice the higher frequency as we get closer to the present?
[Thanks Ryan | Welcome, Boing Boing readers]
15 Comments
Become a member. Support an independent site. Get extra visualization goodness.
See What You Get

2008: German Secret Service buys a CD-ROM containing customer data stolen from a Liechtenstein private bank; the data is then passed on to the Ministry of Finance which is using the stolen material to indict hundreds of citizens of tax evasion.
it’s really interesting to see where data goes after the breach. i wonder where the above 10 ended up.
Pingback: links for 2008-03-15 « Dark Corner of the Empty Head
Pingback: Ten Largest Data Breaches Since 2000
Pingback: 10 LARGEST DATA BREACHES SINCE 2000 « The Catskill Commentator
Pingback: From the Pipeline - 3.16.08 | WinExtra
Pingback: ResourceShelf » Lists & Rankings: 10 Largest Data Breaches Since 2000 - Millions Affected
Pingback: My Place in the Crowd » Blog Archive » Yet another data breach
Pingback: Facebook Security Upgrade Rendered Useless - Private Photos Leaked | FlowingData
Pingback: KWTL - Keeping Within The Law: 10 largest data breaches
About 20 years ago I worked for a bank as a software developer and we had to ask for, prove why and show before and after results of data access against a customer database. We had to present all of that information, in a binder, to an auditor and we’d receive a “yes/no” response within a DAY.
Nowadays people want everything without even considering the ramifications. Perhaps they do consider the ramifications, but without any consequences the ramifications, any notion to be cautious have become side-thoughts.
All its going to take, to tighten up security, is for one precedent setting lawsuit to occur. Some really pissed off citizen and one very enterprising attorney…
@Anthony: I know what you mean. It’s always about more, more, more data, and sometimes it feels like it’s just so that someone can say we have this amount of data stored in our database. So now they have it, they don’t know what to do with it nor how to protect it.
Pingback: ADM 316 - Workshop 2 Postscript « Russ Ray’s Indiana Wesleyan Classroom Blog
Pingback: 10 Largest Data Breaches Since 2000 - Laptop Security Blog
Pingback: From the Pipeline - 3.16.08 — Shooting at Bubbles