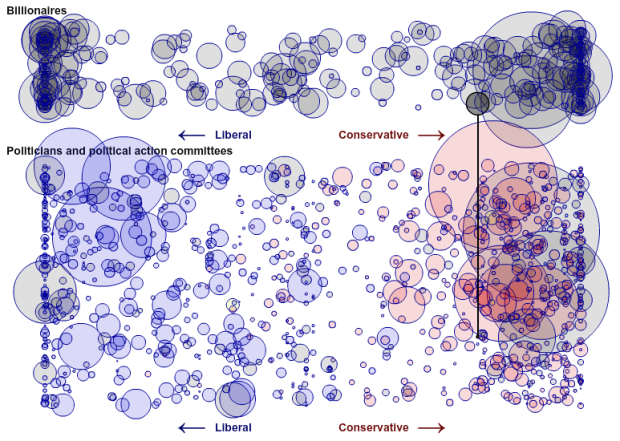
Jon Bruner for Forbes reports on billionaire contributions to politicians over the past four years:
The billionaires on the Forbes 400 list have given more than $30 million to politicians and political action committees since 2006, along with millions more in soft money to politically active groups. Although Forbes 400 members give about 15% more money to Republicans than Democrats, they fund groups across the political spectrum.
On the top are the billionaires, sized by the amount of donations, and on the bottom are the politicians, sized by amount of contributions received. Click on either or use the drop down menus to see the connections.
It lacks some polish, and I’m not totally sure what measurements are used for vertical and horizontal placement, but worth clicking around.
[Thanks, @JonBruner]







 Visualize This: The FlowingData Guide to Design, Visualization, and Statistics (2nd Edition)


