Bruce Feiler for The New York Times describes his concern and distaste for data collection and analysis.
In the last few years, there has been a revolution so profound that it’s sometimes hard to miss its significance. We are awash in numbers. Data is everywhere. Old-fashioned things like words are in retreat; numbers are on the rise. Unquantifiable arenas like history, literature, religion and the arts are receding from public life, replaced by technology, statistics, science and math. Even the most elemental form of communication, the story, is being pushed aside by the list.
The results are in: The nerds have won. Time to replace those arrows in the talons of the American eagle with pencils and slide rules. We’ve become the United States of Metrics.
That’s how the full article reads. Grouchy.
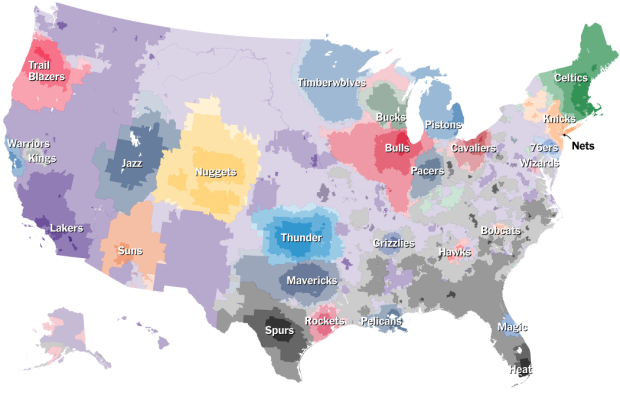
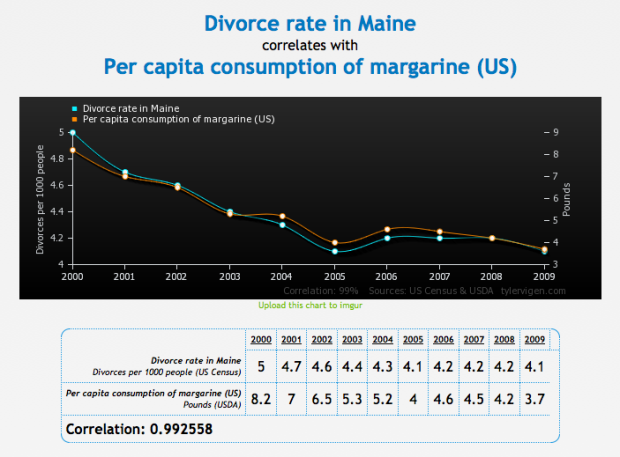
Feiler jumps into a handful of examples that could’ve easily been used as positives, had they been in an article about the boom of data. For instance, he scoffs at a project from New York University and Hudson Yards that aims for a “smart community” that tracks pedestrian traffic, air quality, and energy consumption. Is it better to not know these things? Should we rely entirely on word of mouth for every problem in a city that can easily be fixed? That’s a tough sell.
He does suggest that we need balance between data-informed and data-only decisions, and yes to this absolutely, but he also suggests that we’ve already reached a maximum for the amount of data we want in our lives.
The underlying premise is that if we observe, journal, and experiment our lives in data, we take away from the joy of living. Sports is less fun to watch and food doesn’t taste as good. That’s another tough sell.
Here’s how I see it: I strongly believe in going with your gut instincts. It’s led me in the right direction more often than not. But, sometimes I move in the wrong direction, or I don’t know enough about a subject and all I have is uncertainty. If there’s data there to help then all the better.

 Ben Moore was
  Following the lead of
 Visualize This: The FlowingData Guide to Design, Visualization, and Statistics (2nd Edition)


