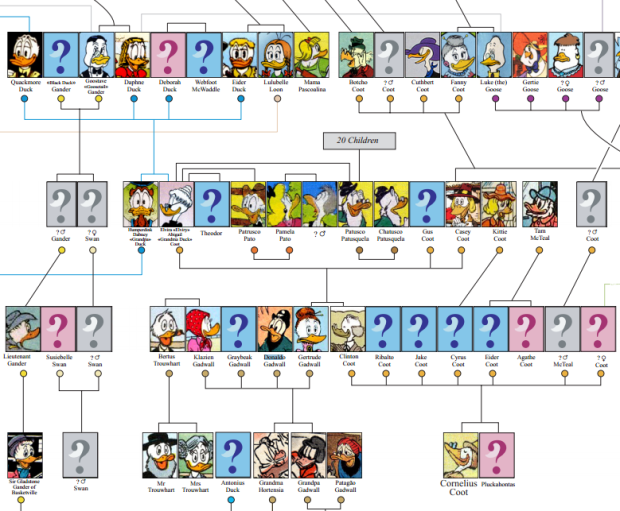
The Donald Duck family tree is huge. Who knew? Above is only a sample. See the full version here.
Donald Duck family tree
Second Edition
 Visualize This: The FlowingData Guide to Design, Visualization, and Statistics (2nd Edition)
 Visualize This: The FlowingData Guide to Design, Visualization, and Statistics (2nd Edition)
New tools, refined process.