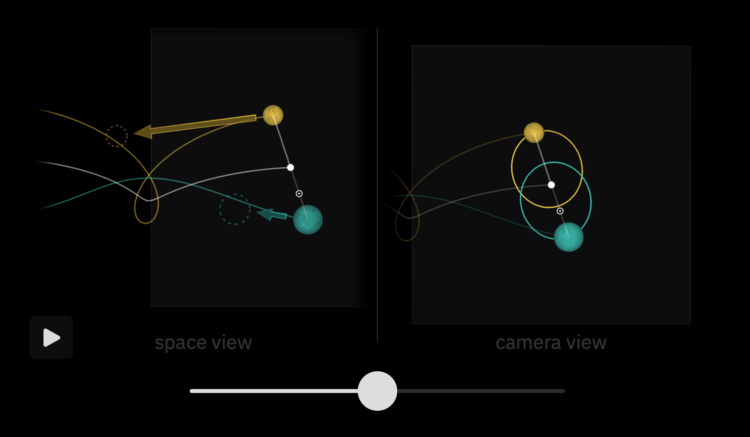
The New York Times collected drone footage and built a 3-D model to reconstruct the scene of the rally. They show four lines of sight: from the location of the gunman and three countersniper teams. You get a sense of distance and obstructions, which partially explain how the gunman could’ve been missed in surveillance.
-
Our physical, mental, and emotional abilities change as we get older, and this can affect the kind of work we do. The National Health Interview Survey (NHIS) asks people if they’ve run into such limitations. These charts show the shifts by age, based on the 2023 sample.
Difficulties increase steadily over the years, but if we’re lucky enough to reach our 80s, there appears to be a steeper drop.
-
Those who run cryptocurrency companies have much to gain from policies that favor them. Follow the Crypto by Molly White tracks the spending:
Cryptocurrency companies have raised hundreds of millions of dollars to put towards buying crypto-friendly politicians and ousting those who have spoken up for stricter regulations to protect consumers in an industry that is fraught with hacks, scams, and fraud. Although parts of the industry have tried to portray this as a grassroots effort, the reality is that a very small number of crypto companies, and the billionaire executives and venture capitalists behind them, are spending millions with a singular goal: to obtain favorable crypto policy, no matter the cost.
Like political contribution dashboards before it, the site uses data from the Federal Election Commission.
-
Nate Silver, who left Disney and the FiveThirtyEight brand last year but took his forecast models with him, is not a fan of the new models on 538, developed by G. Elliott Morris:
I thought the 538 model seemed basically reasonable when it was first published in June, showing the race as a toss-up. But its behavior since the debate — Biden has actually gained ground in their forecast over the past few weeks even though their polling average has moved toward Trump by 2 points! — raises a lot of questions. This may be by design — Morris seems to believe it’s too early to really look at the polls at all. But If my model was behaving like this, I’d be concerned.
Moreover, some of the internal workings of the model are strange, or at least appear that way based on the information Morris has made publicly available.
Silver has his own forecast. It currently places more weight on polls, which makes possible outcomes a lot less favorable for Joe Biden.
There’s much uncertainty around the election right now, so I wouldn’t lean on any forecast numbers at this point. But I like learning the thought process behind the models.
-
Like many, you’ve probably wondered what HTTP response headers are also area codes in the real world, or vice versa. Doug Sillars has you covered with HTTP Area Codes. This is very important.
-
Members Only
-
A lot of immigration talk in the U.S. focuses on Mexico, but immigrants come from other places, of course. Using immigration records from the past decade, the Washington Post provides a breakdown with a streamgraph and a series of maps.
The records come from the Department of Justice, which are released monthly via a FOIA request. (Sidenote: the download speed for this data seems super slow.)
-
It continues to grow more difficult for federal statistical agencies to accurately measure how the United States is doing. The American Statistical Association, in collaboration with George Mason University, released a report that highlights the challenges and possible solutions:
Our bottom-line assessment is that federal statistics are at risk. Federal statistical agencies have many strengths—economic indicators, such as the inflation rate, gasoline prices, and retail sales, roll out weekly, monthly, or quarterly on time and without fail; several agencies and OMB moved rapidly to produce timely, frequent data during Covid-19 on such topics as remote work and Covid-19 effects on health; and the 2020 Census was completed during the height of the pandemic. But the agencies face increasing challenges to their ability to innovate to the extent necessary to meet the nation’s detailed information and evidence requirements in the 21st century (e.g., for data on the economic effects of investments in infrastructure or of AI on work, education, and other sectors of society). The chief statistician’s office in OMB is under- resourced for its necessary functions to coordinate and lead a decentralized statistical system.
-
Using science fiction films as a proxy for what we see in our future, Alvin Chang, for the Pudding, examines the shift in settings, themes, and endings over the past eight decades. Pixel art adds depth to the data, which was partially derived via ChatGPT to categorize films over the years.
I always appreciate Chang’s connections between life and data. An analysis of sci-fi movies could easily get stuck at counts and percentages, but this gives a bit more.
-
How to Use a Slider to Let Readers Customize Charts
A simple user-controlled slider can help readers look at a dataset from their own point of view.
-
It’s gotten more difficult to get into top colleges over the years, but most schools have either admitted students at the same rate or increased admission rates since 2001. Using data from the National Center for Education Statistics, see how your school changed.
-
Reuters explores famine around the world through the lens of starving children in Gaza.
The plight of Gaza’s children is part of a bigger trend. Globally last year more than 36 million children under 5 were acutely malnourished, nearly 10 million of them severely, according to the Global Report on Food Crises, a collaborative analysis of food insecurity by 16 international organizations.
The food shortage in Gaza, while particularly widespread, comes amid a broader spike in extreme hunger as conflicts around the world intensify.
The mosaic plot above is a small part of the full piece. The illustrations make it.
-
Kate Crawford and Vladan Joler created a comprehensive view in Calculating Empires.
Calculating Empires takes Donna Haraway’s provocation literally that we need to map the “informatics of domination.” The technologies of today are the latest manifestations of a long line of entangled systems of knowledge and control. This is the purpose of our visual genealogy: to show the complex interplay of systems of power, information, and circumstance across terrain and time, in order to imagine how things could be otherwise.
-
Members Only
-
Vox explains the process of designing artificial car sounds for electric vehicles to make EV rides safer. Electric vehicles are quiet, which is nice while you’re driving, but complete silence can also be a challenge, because there would be fewer auditory cues for what’s happening.
-
In a collaboration between NHPR and the Pudding, Jason Moon and Russell Samora break down the allegations by time and category. The descriptions of child abuse are hard to read and listen to, but the data provides a granular and affecting view into what happened at the YDC in New Hampshire.
-
A few years removed from applying to colleges, I wondered what admission rates are like these days. The United States Department of Education had the data. Here are rates for about 1,400 institutions that award at least a bachelor’s degree and have at least 500 undergraduates.
-
You’ve probably noticed that the weather forecast can change a lot for predictions many days out. The amount of fluctuation changes depending on where you live. For the Washington Post, Niko Kommenda and Harry Stevens discuss why that is (hint: oceans) with a map and a searchable chart to see your city.
Estimates were compiled by the Meteorological Development Laboratory using data from the National Digital Forecast Database.
-
Speaking of Conservatives losing, Andre Tartar and Demetrios Pogkas for Bloomberg show the other end with party gains.
Angled arrows have become a staple to visualize net differences for regions on a map, but I think this is the first time I’ve seen the shaft of the arrow double as a stacked bar. Colors represent party gains. The head color represents the winner.
-
For the New York Times, Josh Holder and Lauren Leatherby show how the Conservatives lost the election from multiple angles: lost seats, historical vote share, shift of support to Reform, an easy win by Labour, and an age breakdown. It looks bad for Conservatives any way you cut the data.