My first post on FlowingData was in June 2007, and since September of that year, a post has gone up every weekday, save holidays and special occasions. I think that makes me a grandpa in internet time.
2015 was the second full year of FlowingData as my actual job. I spent a lot of time learning new things by working with as much data that time allowed, and then tried to help others understand their data through guides and tutorials. Then there’s the four-week visualization course in R, which seems to be something many were looking for.
The best way to learn and really understand something is to do it yourself. Not only does it help you with your own data, but it also provides another level of appreciation for the work of others’, because you know the challenges and limitations.
Like last year, the most popular things on FlowingData in 2015 were my own projects, by a lot. The Data Stories folks spoke briefly about visualization blogs falling out of style this year, and it’s true to an extent. The sharing and linking aspect is on Facebook and Twitter more these days. But I can’t imagine putting your own work anywhere else besides a place that you own.
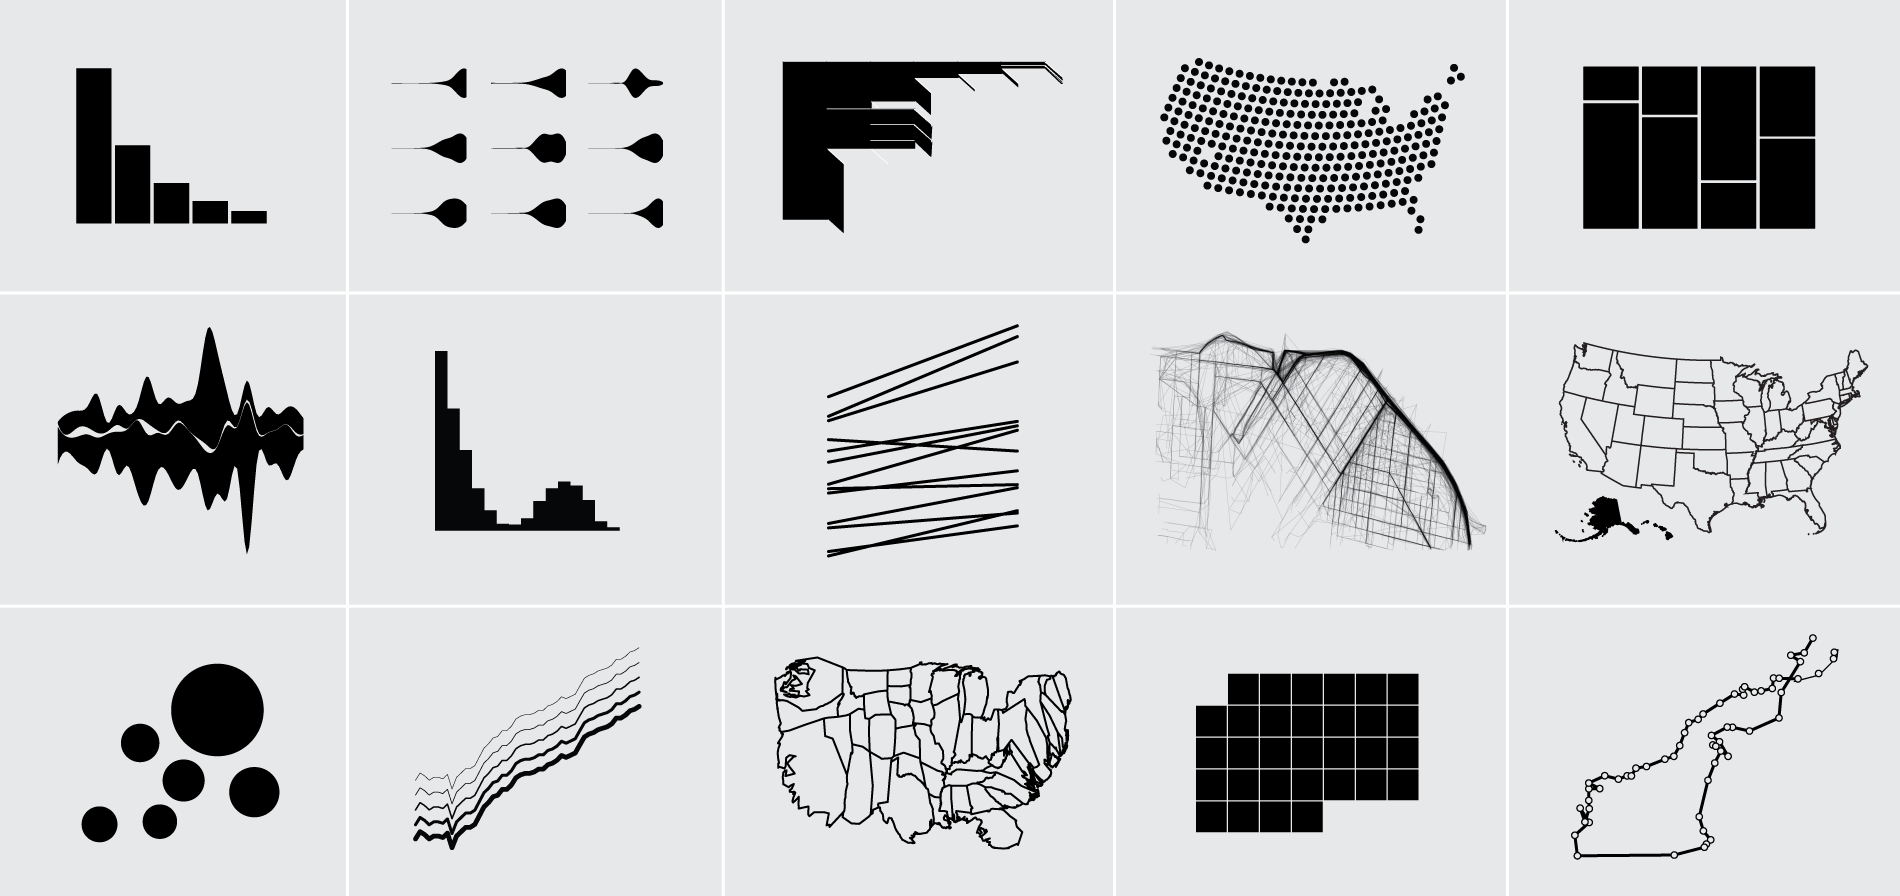
Here are the ten most popular FlowingData projects from 2015:
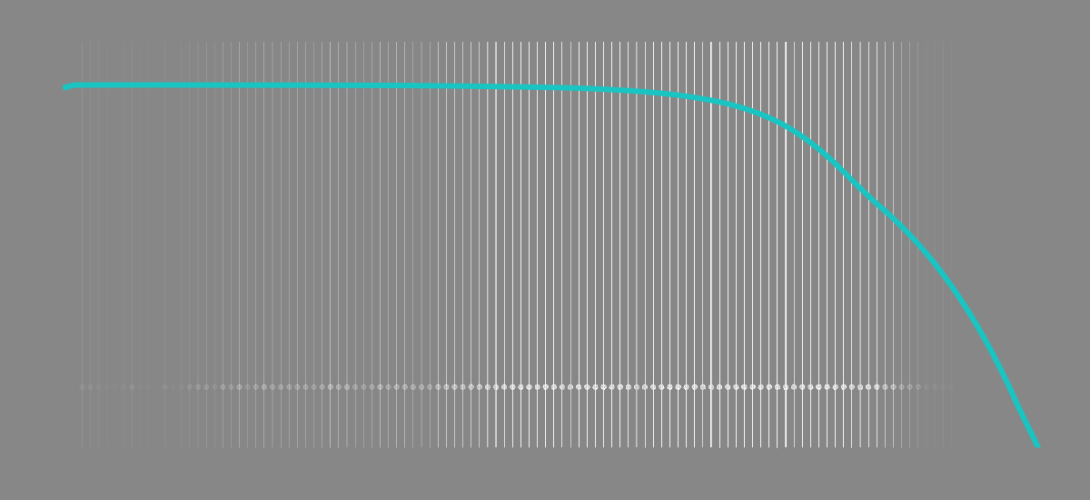
- Years You Have Left to Live, Probably — This is when you will die.
- A Day in the Life of Americans — This is how America runs.
- Top Brewery Road Trip, Routed Algorithmically — This is going to happen.
- Work Counts — There are others just like you.
- How Americans Get to Work — Working from home is best.
- When Do Americans Leave For Work? — Yay, rush hour.
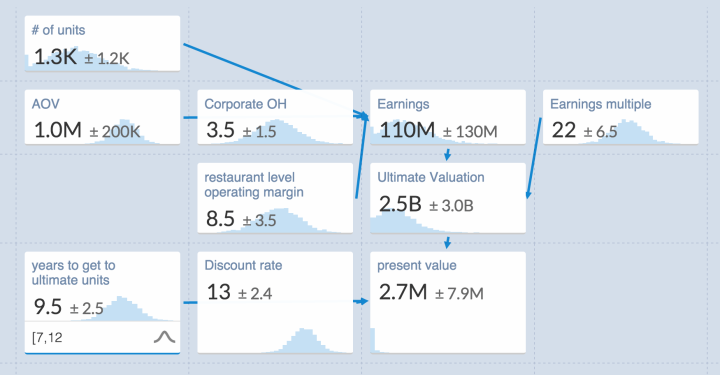
- How We Spend Our Money, a Breakdown — It depends.
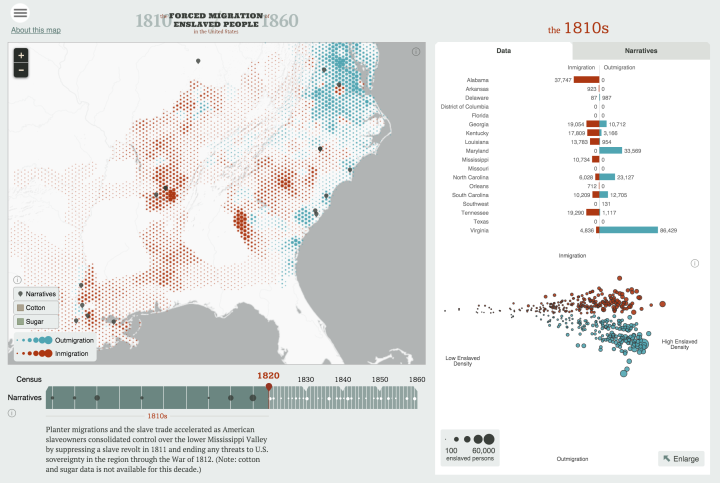
- Reviving the Statistical Atlas of the United States with New Data — Old becomes new again.
- Who Earned a Higher Salary Than You? — This is all anyone really cares about.
- Real Chart Rules to Follow — Some rules aren’t meant to be broken.
I made an extra effort this year, especially in the last few months, to work on interactive graphics. I used to think of interaction as a way for readers to look at data more deeply. As they say, provide an overview first and then let the reader dig into the details.
But lately, I’ve been thinking of interaction for the other way around. Let people go with specifics first to “find themselves” in the data and then if they want, they can take a step back for the wideout view. It seems like data at the individual level provides a good mode of comparison and personal context that can sometimes be missed. I’ll have to explore more in 2016.
Next year brings with it more interaction, animation, and simulation I am sure. Plus data. Of course. Probably more beer, too. Definitely more beer.
I think next year might also be one where I step out of my comfort zone. Or at least I’ll try. I’m starting to feel a bit too comfortable and that leads to boredom, which leads to the dark side. I think this is where the beer comes into play.
In any case, 2015. Another year in the bag. Thanks for reading and your support. I couldn’t do this without you.
See you in 2016.


 Visualize This: The FlowingData Guide to Design, Visualization, and Statistics (2nd Edition)


