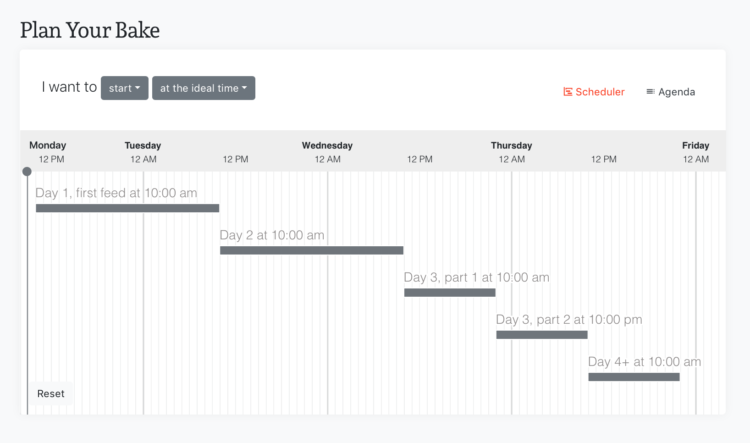
-
Members Only
-
So get this. There are these things called radio stations that broadcast music using frequency modulation. They call it “FM radio.” You don’t download or stream the music, and you don’t get to choose what songs you want to hear right away, but sometimes you can call locally and request a song you like. It’s also free to listen to if you have this thing called a “radio.” In exchange, you have to listen to “commercials” sometimes where someone tries to sell you stuff. Seems like a fair exchange.
Anyways, Erin Davis mapped these radio stations and their coverage, based on FCC data. She joined the data with radio-locator.com data, which provides music genre. This allowed for the splits above.
Technology is amazing.
-
File another one under the sounds-good-on-paper-but-really-challenging-in-practice. Kashmir Hill, for The New York Times, describes the challenges of new laws that allow users to request the data that companies collect on them:
Since then, two groups of researchers have demonstrated that it’s possible to fool the systems created to comply with G.D.P.R. to get someone else’s personal information.
One of the researchers, James Pavur, 24, a doctoral student at Oxford University, filed data requests on behalf of his research partner and wife, Casey Knerr, at 150 companies using information that was easily found for her online, such as her mailing address, email address and phone number. To make the requests, he created an email address that was a variation on Ms. Knerr’s name. A quarter of the companies sent him her file.
“I got her Social Security number, high school grades, a good chunk of information about her credit card,” Mr. Pavur said. “A threat intelligence company sent me all her user names and passwords that had been leaked.”
Yay.
I’m not saying these new laws are bad, but maybe get yourself a good password manager and change all those duplicate passwords.
-
For The New York Times, Jennifer Valentino-DeVries looked at the current state of facial recognition in law enforcement:
Officials in Florida say that they query the system 4,600 times a month. But the technology is no magic bullet: Only a small percentage of the queries break open investigations of unknown suspects, the documents indicate. The tool has been effective with clear images — identifying recalcitrant detainees, people using fake IDs and photos from anonymous social media accounts — but when investigators have tried to put a name to a suspect glimpsed in grainy surveillance footage, it has produced significantly fewer results.
Not quite CSI levels yet, huh.
-
I’m terrible at names, but maybe data can help. Put in your sex, the decade when you were born, and start putting in your name. I’ll try to guess before you’re done.
-
Following up on his mini-app to draw ridgeline maps for elevation, Andrei Kashcha made a tool to draw a streets map of anywhere in the world.
Enter a city, and using data from OpenStreetMap, you’ve got yourself a map for export. You can also easily change the color scheme to your liking, which is fun to play with as you scroll back and forth.
Finally, Kashcha also put the code up on GitHub.
-
For the Absurd America section of The Washington Post, Sergio Peçanha asks the question that’s on everyone’s mind: Are cows better represented in the Senate than people?
-
Members Only
-
The Washington Post asked Democratic candidates a series of policy questions. To see which one agrees with you most, the Post made a quiz:
Now, it’s your turn to answer. Below are 20 questions we found particularly interesting, mostly because they reveal big differences between the remaining major candidates. We haven’t asked the campaigns about every topic, but this selection tries to cover a variety of issues. Answer as many as you like.
It was also a good way to catch up on what candidates currently stand for. I’ve found it hard to keep up lately.
-
When I think government structure, I tend to think in general overviews where you have some branches that check and balance each other. But when you look closer, within organizations that make up the bureaucracy, you’ll find lots of variation. Peter Cook laid it out for the United Kingdom with org charts for each department.
And apparently org charts are also known as organograms? Where have I been on this one? [Thanks, Peter]
-
From 1928, the year of the first Academy Awards, to 2019, there have been 455 nominations for Best Director. Of those, 18 of them went to non-white men.
-
[arve url=”https://www.youtube.com/watch?v=wAIZ36GI4p8″ loop=”no” muted=”no” /]
In 2007, Noah Kalina posted a time-lapse video showing a picture of himself every day for six years. Pop culture swallowed it up. There was even a Simpsons parody with Homer. After another six years, it was a video for twelve years’ worth of photos. Kalina has kept his everyday project going, and the above is the new time-lapse for two decades.
This brings back graduate school memories for me as I argued for personal data collection as a diary instead of just for quantified self. I often led with Kalina’s project as a primary example. He ages, his background changes, and his camera improves, but the angle stays the same.
It’s a very tiny window into his life, played out over time, but I bet for Kalina it means a bit more. [via kottke]
-
It’s difficult to emphasize how much life changes when a child comes into the picture. Caitlin Hudon made a chart to show how her daily schedule shifted dramatically.
For a while, it seems like all of your free time is gone for good, but ever so slowly, you get a little bit of it back as they grow more independent.
-
Based on a Morning Consult/Politico survey, most people don’t know where Iran is:
As tensions between the United States and Iran rise in the aftermath of the American drone strike that killed the country’s most powerful commander, Gen. Qassem Soleimani, a new Morning Consult/Politico survey finds fewer than 3 in 10 registered voters can identify the Islamic republic on an unlabeled map.
The data is noisy, with selections in the ocean, and in the world view, with selections of the United States and Canada. So I’m not totally sure what to make of that, but it’s clear a lot of people don’t know where Iran is, which might be part of why Americans don’t have a clear opinion about the current affairs.
All I can think about are these geographic stereotype maps from 2010.
-
Outside of Australia, it can be a challenge to get a grasp of how bad the bushfires actually are. There have been some attempts that overlay a map of Australia over various locations, but they’ve varied in accuracy. This scrolling unit chart by Reuters Graphics makes the comparison more concrete.
Each square represents a square kilometer, a counter at the top ticks up as you scroll, and geographic points of reference appear as you go down. Effective.
-
Members Only
-
How to Make Line Charts in Python, with Pandas and Matplotlib
The chart type can be used to show patterns over time and relationships between variables. This is a comprehensive introduction to making them using two common libraries.
-
In 2018, there was a squirrel census count at Central Park in New York. New York Times graphics editor Denise Lu participated in the citizen science project “to collect the kind of data that underlies the work I do every day.” Lu did a short but interesting piece on her experience counting squirrels.
You can download the data via NYC Open Data.
Now I’m wondering if I should apply to be a 2020 Census counter. Um, for people, not squirrels.
-
The New York Times zoomed in on southeastern Australia where the fires have hit the worst. They also used small multiples to show the scale of the fires the past few months against previous years.
-
With all of the maps of fire in Australia, be sure to check out this piece by Georgina Rannard for BBC News on how some of the maps can easily be misinterpreted when seen out of context.