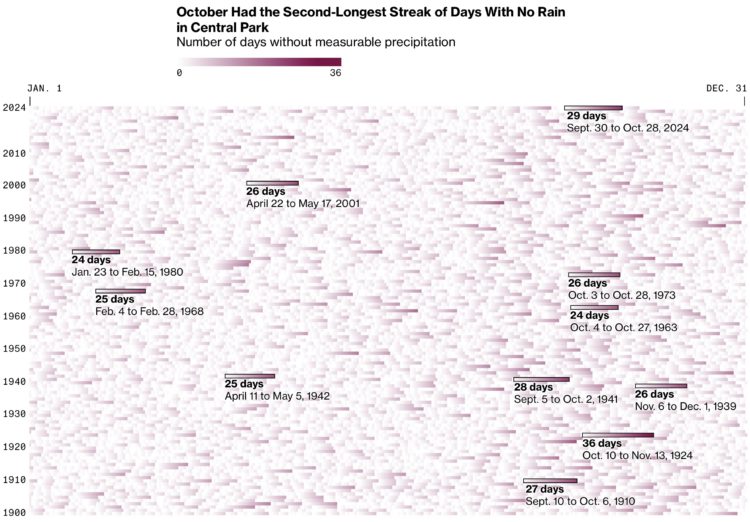
New York City recently issued a drought warning because of an abnormally dry fall. For Bloomberg, Denise Lu used a heatmap to highlight day streaks without rain via precipitation measurements in Central Park.
It’s more of an event-driven graphic than a pattern-driven one. I wonder if reversing the color scale would be useful here. Would it make the longer streaks appear “dryer” with empty space?

 Visualize This: The FlowingData Guide to Design, Visualization, and Statistics (2nd Edition)