Reuben Fischer-Baum for The Washington Post looks at professional football expectations given their…
Statistical Visualization
Finding patterns, distributions, and anomalies.
-
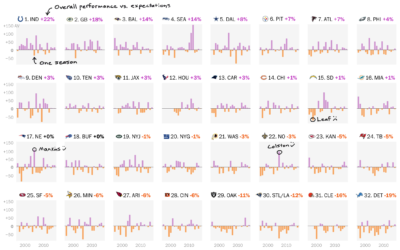
NFL draft performance vs. expectations
-
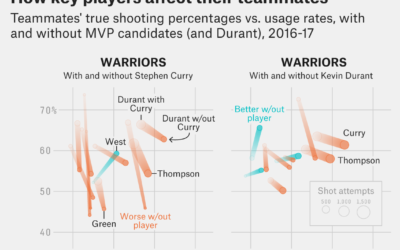
Stephen Curry for MVP, because he makes his teammates better the most
The choice for Most Valuable Player in the NBA is only minimally about…
-
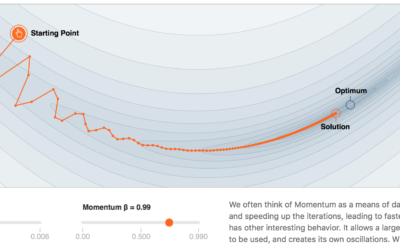
Why momentum works
Gabriel Goh models momentum over at the new machine learning journal Distill. The…
-
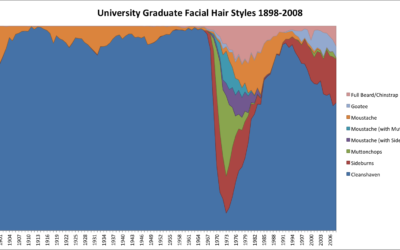
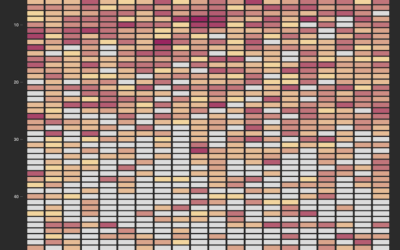
A century of facial hair styles
Facial hair styles change with the years. One year it might be more…
-
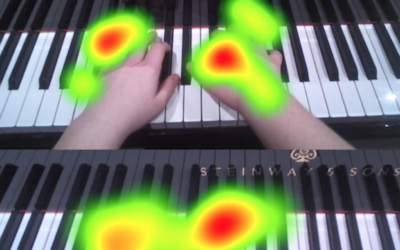
Pianist eye tracking
What does a pianist look at while playing? Put a pair of eye…
-
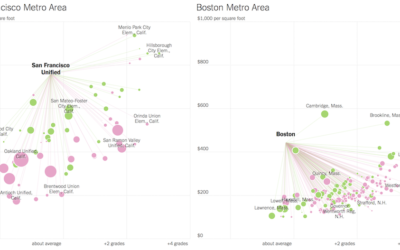
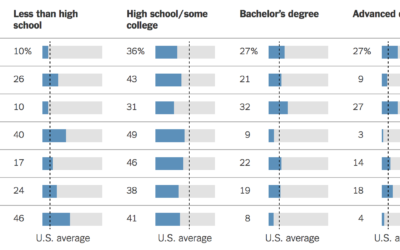
Looking for more affordable homes and better schools in the suburbs
Families often move out of the city to the suburbs for more affordable…
-
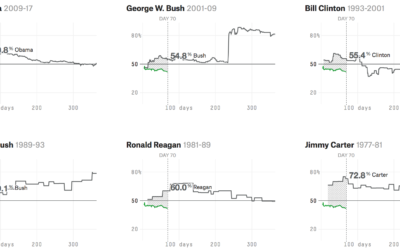
Trump approval ratings compared to past presidents
Using multiple polls as their source data, FiveThirtyEight is tracking approval and disapproval…
-
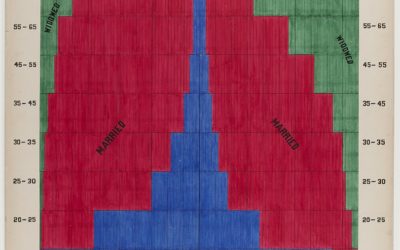
Graphs from 1900 that depict a snapshot of African American life
In 1900, W. E. B. Du Bois and his students drew a series…
-
Demographics for immigrants from banned countries
As I’m sure you know, the current administration banned immigrants from seven countries…
-

Typeface interweaves words and graphs
Datalegreya is a new typeface by Fig that lets you intertwine a graph…
-
Showing uncertainty during the live election forecast
During the election, The New York Times showed a live gauge to show…
-
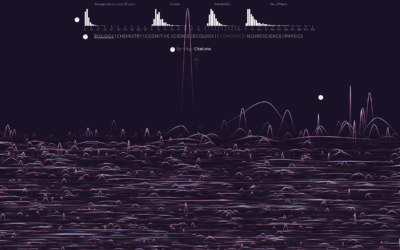
Randomness of scientific impact
A group of researchers wondered if there was a trend or predictability for…
-
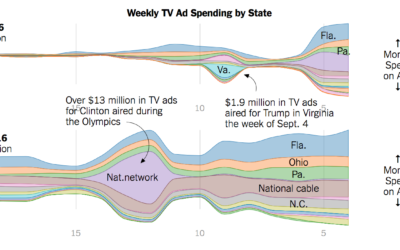
Ad spending for Clinton and Trump
Adam Pearce for the New York Times charted ad spending for Clinton and…
-
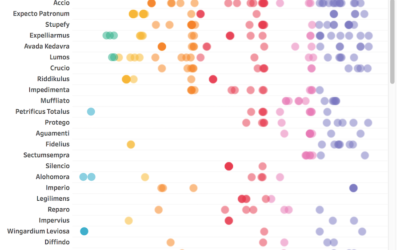
All the Harry Potter spells, when they were used
I often stare far into the distance and ponder world’s greatest questions —…
-
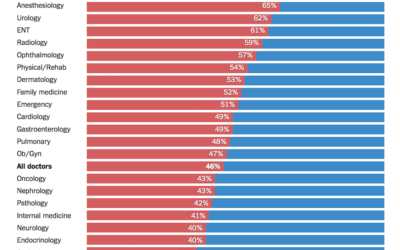
Doctors’ political leanings
Based on data from researchers at Yale, the Upshot charts party registration by…
-
Finding the biggest busts and steals from NBA drafts past
Picking basketball players for a professional team is no easy task. College and…
-
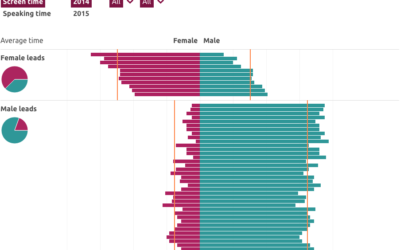
Computed screen time for men and women
In a collaborative effort, the Geena Davis Institute on Gender in Media computed…
-
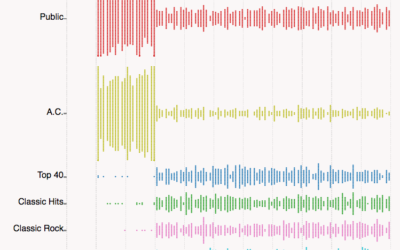
Radio station frequencies, by genre
In most areas in the United States, lower FM frequencies are reserved for…
Recently for Members
Second Edition
 Visualize This: The FlowingData Guide to Design, Visualization, and Statistics (2nd Edition)
 Visualize This: The FlowingData Guide to Design, Visualization, and Statistics (2nd Edition)
New tools, refined process.
Browse by Chart Type See All →


