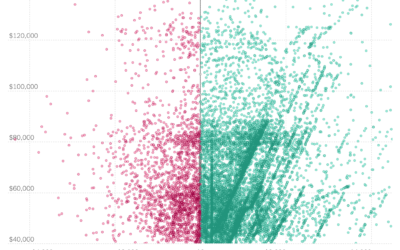
Research by Raj Chetty, Nathaniel Hendren, Maggie Jones, and Sonya Porter from the…
Statistical Visualization
Finding patterns, distributions, and anomalies.
-
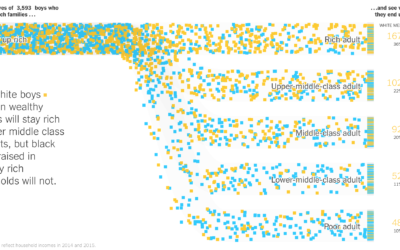
Black boys dropping income levels as adults
-
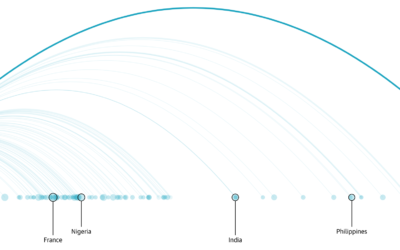
One-way tickets out for homeless people
Many cities provide free bus tickets for homeless people who want to relocate.…
-
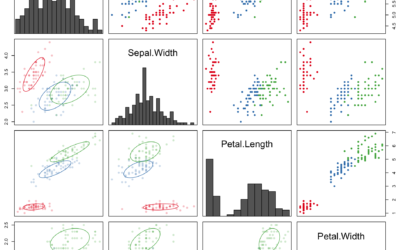
Beginner’s guide to visualization literacy
Mikhail Popov, a data scientist at the Wikimedia Foundation, led a workshop on…
-
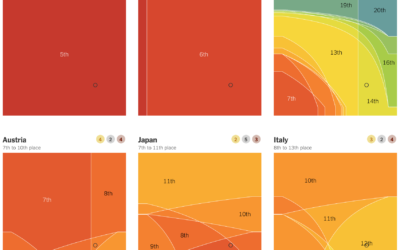
Who’s winning the medal race, depending on how you weight the medals
Every year, we look at the medal counts of each country. Who’s winning?…
-
Roger Federer career in rankings and wins
Professional tennis player Roger Federer won his 20th Grand Slam title recently. He’s…
-
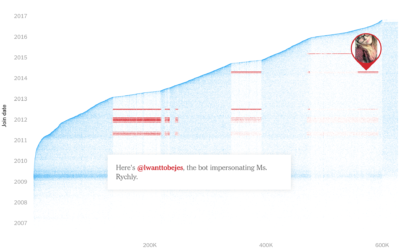
Finding fake followers
This fake follower piece by Nicholas Confessore, Gabriel J.X. Dance, Richard Harris, and…
-
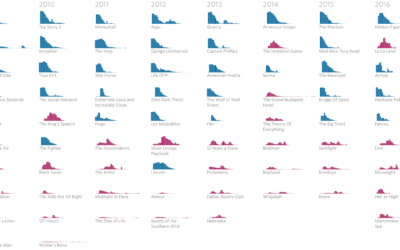
Release strategies for Oscar-nominated films
Evie Liu and William Davis, reporting MarketWatch, looked at release strategies of Oscar…
-
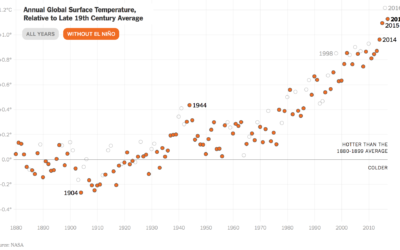
Surprise, the world was warmer again in 2017
According to NASA estimates, 2017 was the second warmest year on record since…
-
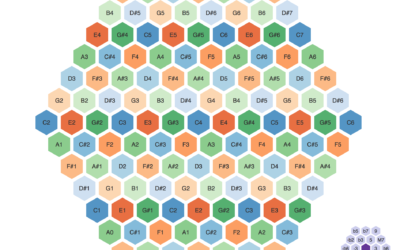
Musical hexagons
This is a fun ditty by Vasco Asturiano. I’m a little too far…
-
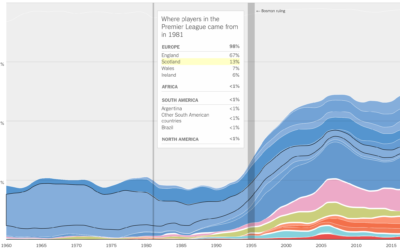
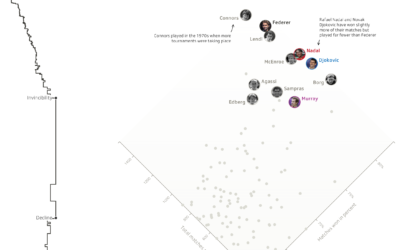
Where athletes in professional sports come from
Sports are growing more international with respect to the athletes. Gregor Aisch, Kevin…
-
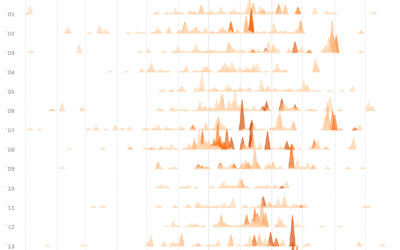
Charting all the major California wildfires since 2000
Based on data from CAL FIRE, Erin Ross, for Axios, plotted California wildfires…
-
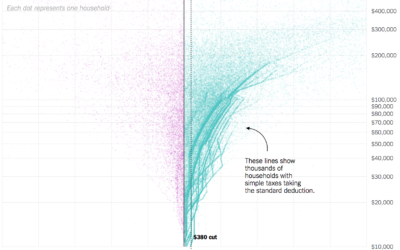
How your taxes will change
I’m pretty sure this is all that most people want to know. The…
-
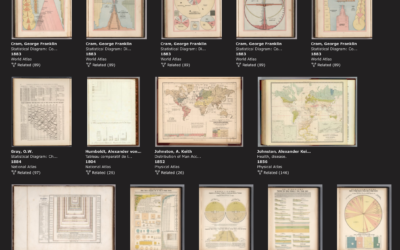
Rumsey Collection with a data visualization subject tag
The David Rumsey Map Collection, known for its many browsable historical maps, now…
-
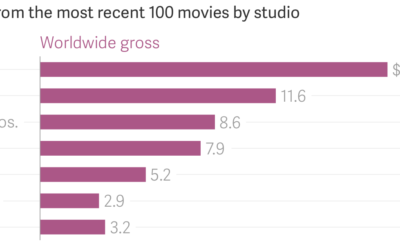
Disney-Fox market share
Disney is set to buy 21st Century Fox for $52.4 billion. I honestly…
-
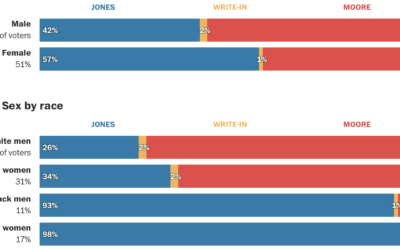
Alabama voter demographics
Democrat Doug Jones won in the senate race against Republican Roy More last…
-
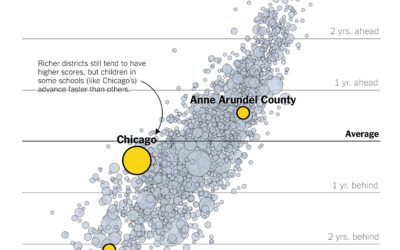
Where students learn the most
Emily Badger and Kevin Quealy, reporting for the Upshot, highlights research from Sean…
-
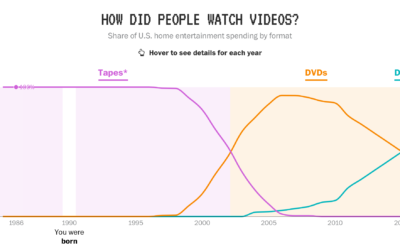
Tech generations, as seen through video source, music players, and internet access
In a fun piece by Reuben Fischer-Baum, reporting for The Washington Post:
In… -
Middle-class tax cuts and increases from Senate bill
A lot of tax debate centers around the “average” American family, with focus…
Recently for Members
Second Edition
 Visualize This: The FlowingData Guide to Design, Visualization, and Statistics (2nd Edition)
 Visualize This: The FlowingData Guide to Design, Visualization, and Statistics (2nd Edition)
New tools, refined process.
Browse by Chart Type See All →


