So you have your data neat and tidy in a single spreadsheet, and it’s finally time to explore. There’s a problem though. Maybe you don’t know what to look for or where to start. Maybe you’re not in the mood for a trip to clicksville to make all those charts. With a new exploration tab, Google Sheets might be a good place to start.
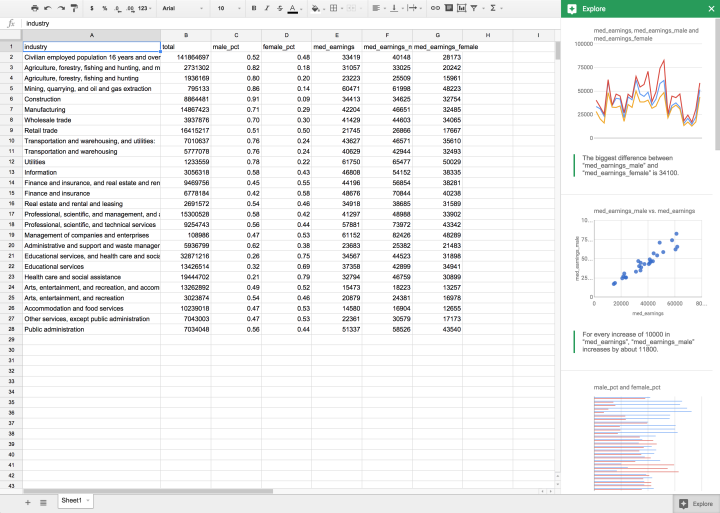
Open the spreadsheet in the browser as usual, and then click the Explore tab in the bottom right corner. A panel opens on the right, and the app tries to find interesting bits and create relevant charts automatically, based on the structure and context of the data.
If the app thinks it found something interesting — such as a correlation, trend, or outlier — it describes the finding in words underneath a chart.
Here’s the pitch video:
I tried it on some of my own spreadsheets, and it works pretty much as advertised. Obviously you’re not going to get super complex findings from a spreadsheet program, but it seemed to pick out columns and combinations well.
For example, I opened the tab on a spreadsheet of median male and female earnings for various industries that also included male-female ratios, overall medians, and total people. I automatically got back the biggest difference between the male and female column, correlation between the medians, the distribution of the totals, and an outlier for the total.
As might be expected, the automatic generation is not perfect. It stalled at the beginning with my income and expenses spreadsheet. I think it doesn’t like dates so much, and mostly wants numeric values. Also, some charts weren’t ones that I would use, and not all of the insights were relevant.
That said, it seems a good way to start the exploration phase. I imagine this being useful for business-related data. And this by the way is part of a bigger Google Docs update, which had the classroom in mind. Google Sheets would’ve been sweet for my sixth grade science fair project.


 Visualize This: The FlowingData Guide to Design, Visualization, and Statistics (2nd Edition)
