There’s less than a month until taxes are due. It’s the most wonderful…
Statistical Visualization
Finding patterns, distributions, and anomalies.
-
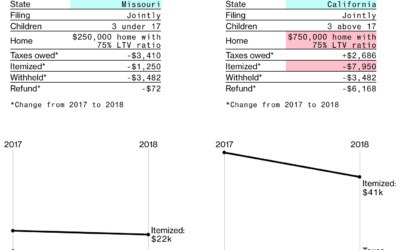
Tax changes for different groups
-
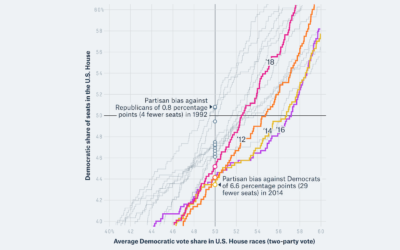
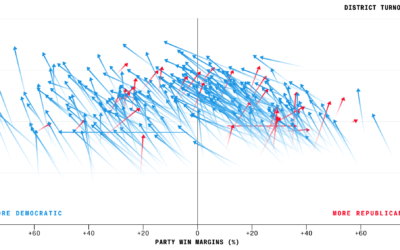
How to spot a partisan gerrymander
For FiveThirtyEight, William T. Adler and Ella Koeze describe how a metric called…
-
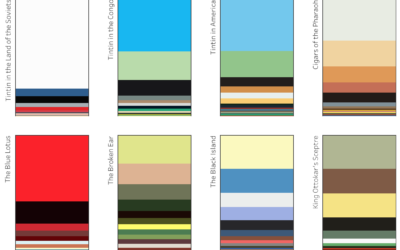
Colors of Tintin
Marian Eerens charted the colors of each Adventures of Tintin book cover. The…
-

Charting cholera, beyond John Snow
John Snow, who often gets the credit for showing the geographical patterns of…
-
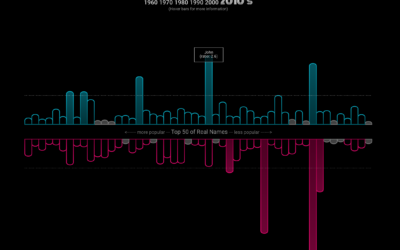
Names in movies vs. real life
Here’s a fun spin on the name analysis genre by Mary Zam. She…
-
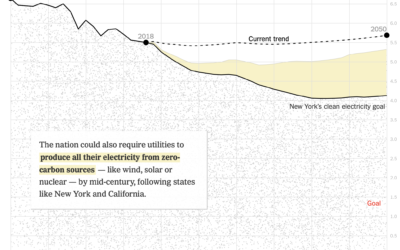
How fast emissions would reduce if other plans were adopted
The United States is doing pretty poorly in reducing emissions. For The New…
-
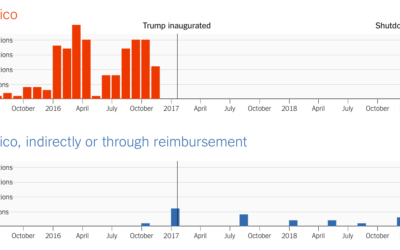
Language used for the wall
For The Upshot, Kevin Quealy continues on his path looking at the words…
-
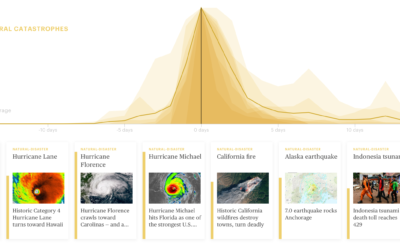
News story lifespan charts
A wideout view of the news cycle can look like a series of…
-
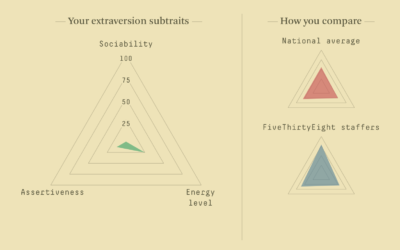
Personality quiz with traits on a spectrum
Ah, the online personality quiz, oh how I missed you. Oh wait, this…
-
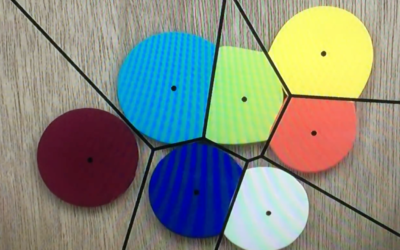
Voronoi diagram from smooshing paint between glass
It feels like magic. I think there’s a magic trick percolating in there…
-
Higher turnout for midterm elections
Bloomberg charted voter turnout for the just past midterm elections, comparing 2018 against…
-
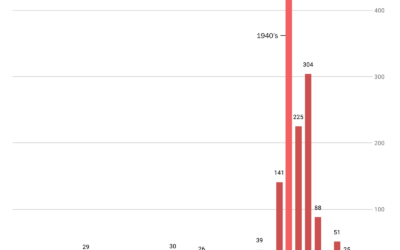
Old Christmas songs get all the play time
Jon Keegan scraped the playlist from the local radio station’s all-Christmas playlist for…
-
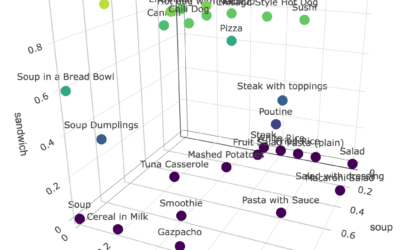
Soup-Salad-Sandwich space
The debate rages on about the categorization of food items as soup, salad,…
-
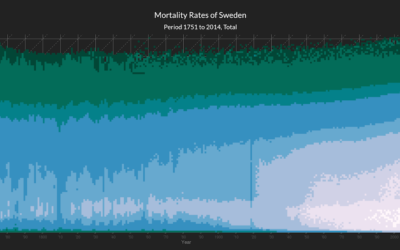
Heatmap shows deaths by age in different countries
This interactive heatmap by Jonas Schöley shows mortality rates by age. Just use…
-

Teaching kids data visualization
Jonathan Schwabish gave his fourth-grade son’s class a lesson on data visualization. He…
-

A collection of Charles-Joseph Minard’s statistical graphics
Charles-Joseph Minard, best known for a graphic he made (during retirement, one year…
-
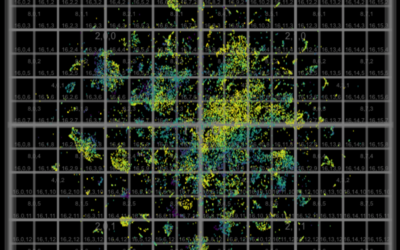
Millions of data points with deep scatterplots
Ben Schmidt uses deep scatterplots to visualize millions of data points. It’s a…
-
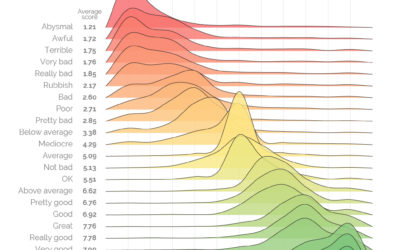
Measuring the varied sentiments of good and bad words
There was a survey a while back that asked people to provide a…
Recently for Members
Second Edition
 Visualize This: The FlowingData Guide to Design, Visualization, and Statistics (2nd Edition)
 Visualize This: The FlowingData Guide to Design, Visualization, and Statistics (2nd Edition)
New tools, refined process.
Browse by Chart Type See All →


