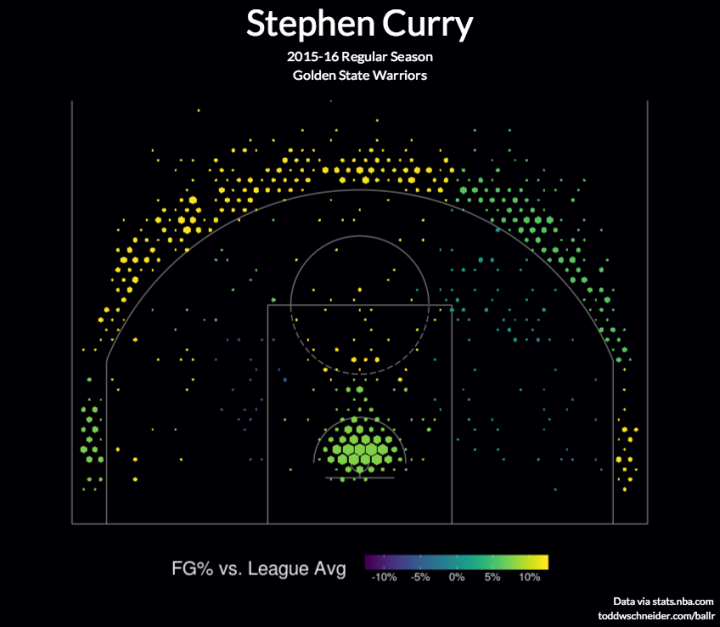
Based on data from the NBA stats API and using the visual layout popularized by Kirk Goldsberry, Todd Schneider gives you BallR, made with R and Shiny.
BallR lets you select a player and season, then creates a customizable chart that shows shot patterns across the court. Additionally, it calculates aggregate statistics like field goal percentage and points per shot attempt, and compares the selected player to league averages at different areas of the court.
Fun.
The best part though is that Schneider made the code available on GitHub. See how it was done or roll your own.


 Visualize This: The FlowingData Guide to Design, Visualization, and Statistics (2nd Edition)
