I feel like whenever I watch a British film, I see a Harry…
Network Visualization
Fun with links, nodes, and edges.
-
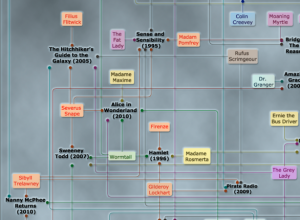
Movies with multiple Harry Potter wizards
-
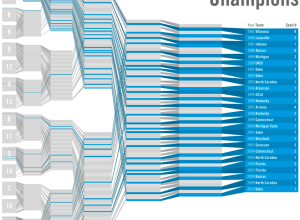
March Madness bracketology – winners and losers
Working off last year’s bracketology graphic, Leonardo Aranda took a simpler approach in…
-
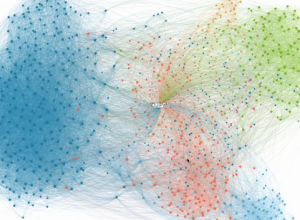
Explore your LinkedIn network visually with InMaps
LinkedIn has been having some fun with their data lately. They opened up…
-
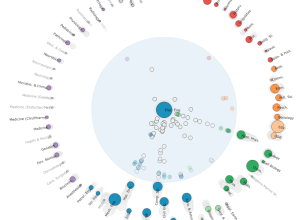
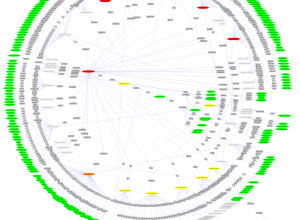
Similarities between PhD dissertations
Certain fields of study tend to cover many of the same topics. Many…
-
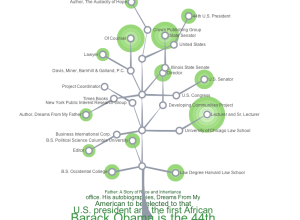
Build your LinkedIn career tree
How did you get to where you are now in your work life?…
-
Why network visualization is useful
AT&T Labs’ Infoviz research group describes network graphs and their many uses:
There… -
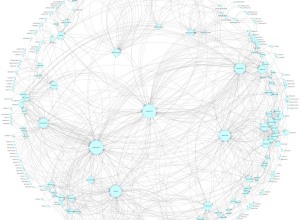
Mexican drug cartel network map
I’m not entirely sure what we’re looking at here, other than relationships between…
-
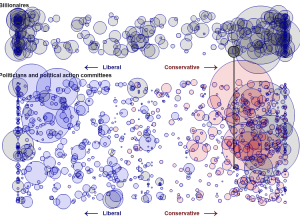
Billionaires’ favorite politicians
Jon Bruner for Forbes reports on billionaire contributions to politicians over the past…
-
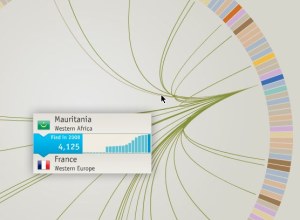
Where refugees come from
Thousands of people flee their country every year, and the travel patterns are…
-
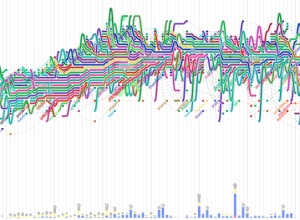
Software evolution storylines
In a follow up to code_swarm, a visualization to show the development of…
-
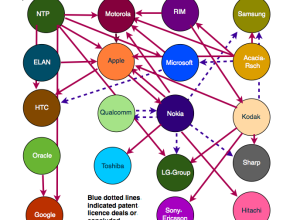
Mobile patent lawsuits
It seems like all the mobile groups are suing each other these days.…
-
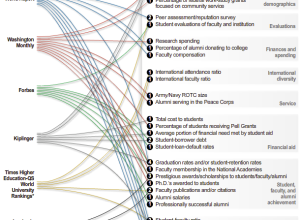
Various ways to rate a college
There are a bunch of college ratings out there to help students decide…
-
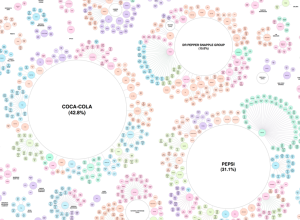
Pseudo-variety and ownership of the soft drink industry
When you buy soft drinks and other beverages at the grocery store, most…
-
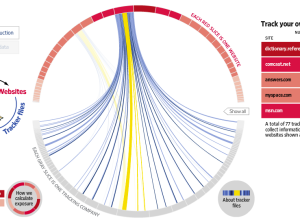
What online marketers know about you
Andrew Garcia Philips and Sarah Slobin (plus five data gatherers) of The Wall…
-
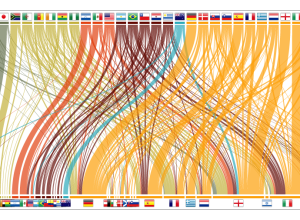
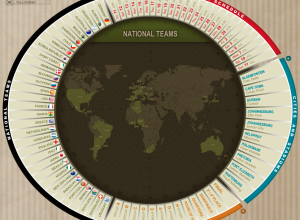
Imported World Cup players
The World Cup is an event where countries from all over the world…
-

Wireless networks in the physical world
For the most part, you go about your day-to-day with little knowledge of…
-
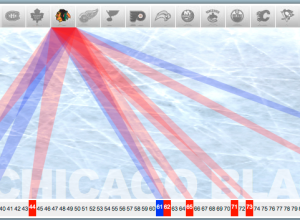
Stanley Cup winners and losers
Speaking of sports most Americans know nothing about, Robby Macdonell visualizes NHL Stanley…
-
Interactive World Cup schedule
I was born in and live in the United States, so to me…
Recently for Members
Second Edition
 Visualize This: The FlowingData Guide to Design, Visualization, and Statistics (2nd Edition)
 Visualize This: The FlowingData Guide to Design, Visualization, and Statistics (2nd Edition)
New tools, refined process.
Browse by Chart Type See All →


