Twitter is an organic online location, full of retweets, conversations, and link sharing.…
Network Visualization
Fun with links, nodes, and edges.
-
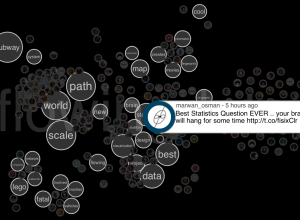
Spot visualizes tweet commonalities
-
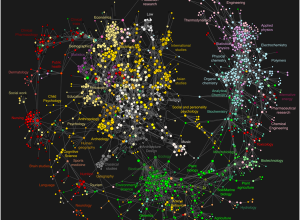
High-resolution maps of science
While we’re on the topic of academic papers and how they’re linked, Johan…
-
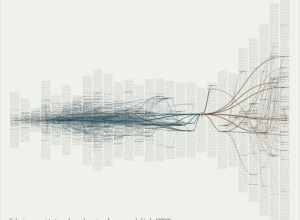
Visualizing citations in research literature
From Autodesk Research, Citeology is an interactive that visualizes connections in academic research…
-
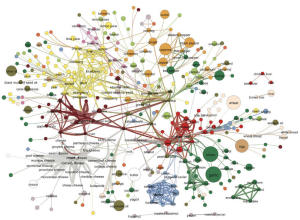
Backbone of the flavor network
Food flavors across cultures and geography vary a lot. Some cuisines use a…
-
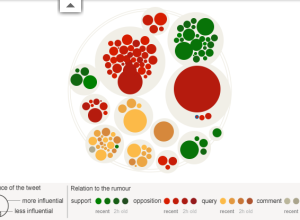
Rise and fall of riot rumors on Twitter
During the riots in London this past summer, a lot of information spread…
-
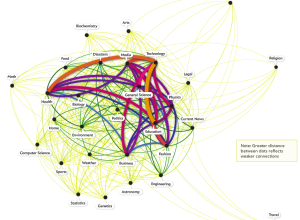
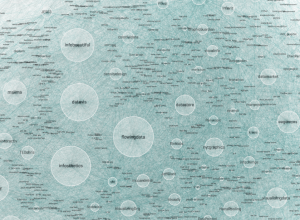
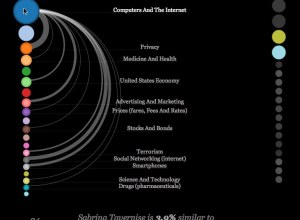
What topics science lovers link to the most
Hilary Mason, chief scientist at bitly, examined links to 600 science pages and…
-
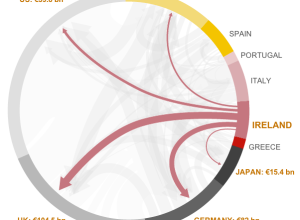
Who owes what to whom in Europe
As the Eurozone crisis develops, the BBC News has a look at what…
-
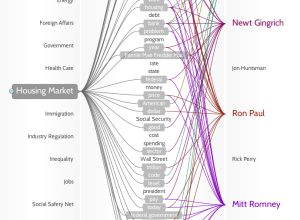
Politilines shows what candidates talk about during debates
If you don’t watch the candidate debates — and let’s face it, that’s…
-
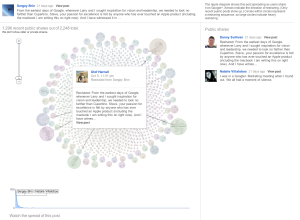
Google+ Ripples show influence and how posts are shared
Posts and links get shared over and over again, but we usually don’t…
-
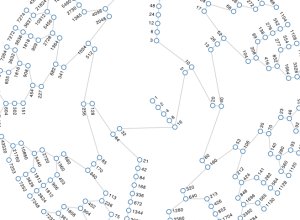
All numbers lead to one
In 1937, mathematician Lothar Collatz proposed that given the following algorithm, you will…
-

Who owns the beer
When you walk the beer aisle at the grocery store, there are lots…
-
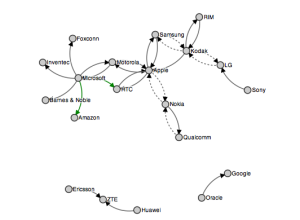
Mobile patent lawsuits
Mike Bostock visualizes mobile patent lawsuits, improving on a graphic from Thomson Reuters…
-
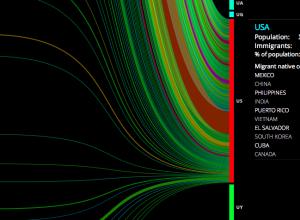
People moving
Hundreds of thousands of people immigrate every year, with some countries seeing higher…
-

How tech companies are interconnected
Sarah Kessler and Nick Sigler examine the interconnectedness between major tech companies. I…
-
The Vizosphere
There are lots of people on Twitter who talk visualization. Moritz Stefaner had…
-

Computer assisted design and the 9/11 Memorial
Digital artist Jer Thorp discusses the algorithm and tool used to arrange 9/11…
-
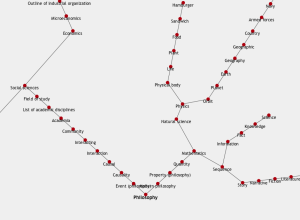
All roads lead to philosophy, on Wikipedia
Jeffrey Winter tests a hunch about links leading to philosophy on Wikipedia:
There… -
Exploring NYT news and its authors
The IBM Visual Communication Lab published their first of what I hope many…
Recently for Members
Second Edition
 Visualize This: The FlowingData Guide to Design, Visualization, and Statistics (2nd Edition)
 Visualize This: The FlowingData Guide to Design, Visualization, and Statistics (2nd Edition)
New tools, refined process.
Browse by Chart Type See All →


