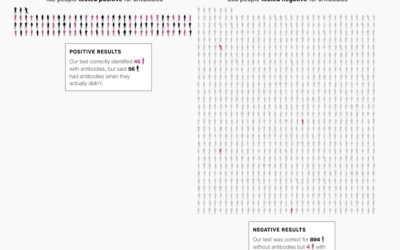
Medical tests do not always provide certain results. Quartz illustrated this with the…
Infographics
Telling stories with data and graphics.
-
Coronavirus testing accuracy
-
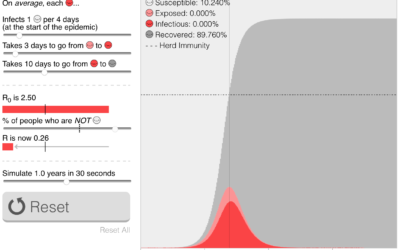
Playable simulations to decide what happens next
The timelines keep shifting and people are getting antsy for many valid (and…
-
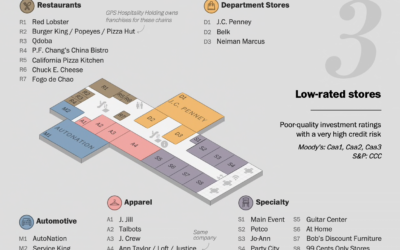
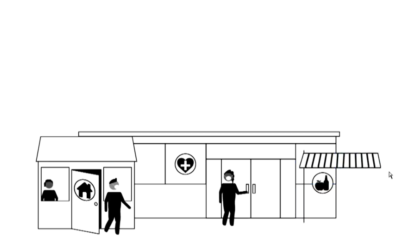
Pretend mall map to show at-risk brands
Many brands that were at-risk before the pandemic or ran with low profit…
-
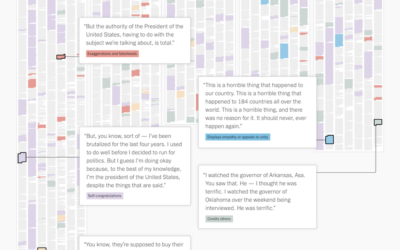
Text from press briefings categorized
The New York Times went through the words used during press briefings, pulling…
-
How We Reopen
Vi Hart, along with a group of experts from different political backgrounds and…
-
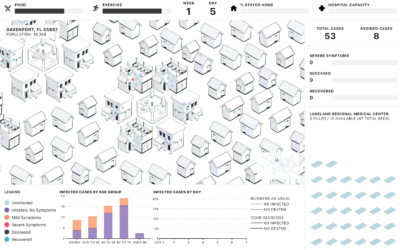
People of the Pandemic, a game that simulates social distancing in your ZIP Code
People of the Pandemic is a game that lets you choose how many…
-
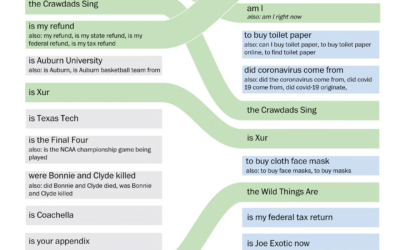
Change in Google searches since the virus
The coronavirus changed what information we search for. Has anyone been more interested…
-
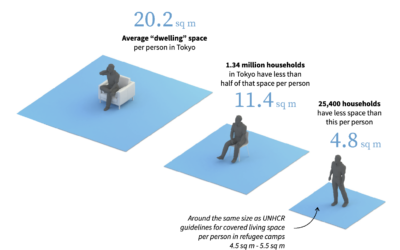
Sheltering in small places
For many, sheltering in place means sheltering in relatively small places. Reuters zoomed…
-
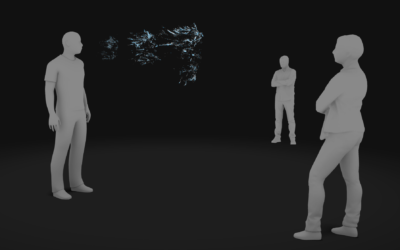
Simulation of droplets while social distancing
Using 3-D simulation data from the Kyoto Institute of Technology, The New York…
-
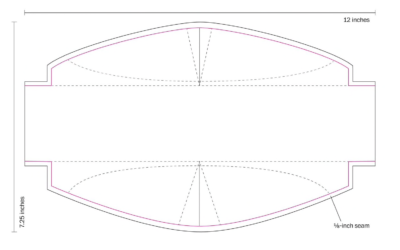
How to sew a mask, with a template
The Washington Post provides clear instructions on how to sew your own mask.…
-
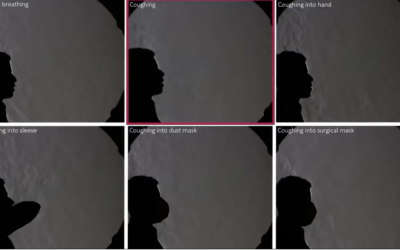
Different cough coverings, varying air spread
From researchers at Bauhaus-University Weimar, this video shows how various methods of covering…
-
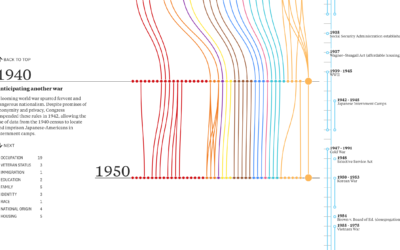
Evolution of Census questions
On the surface, the decennial census seems straightforward. Count everyone in the country…
-
Break the chain
For The Spinoff, Toby Morris illustrates how individuals can break a chain of…
-
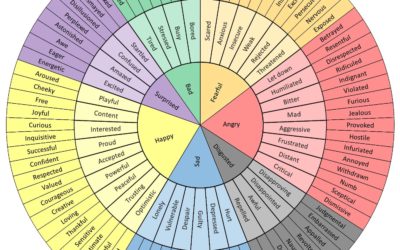
Wheel of emotional words, in case you’re having trouble finding the words these days
You’re probably feeling a range of emotions these days. It helps if you…
-
Coronavirus Explained and What You Should Do
Kurzgesagt, which make videos to explain complex and abstract concepts in an understandable…
-
How washing your hands for 20 seconds does the trick
Vox used a lotion that mimics viruses to demonstrate the power of washing…
-
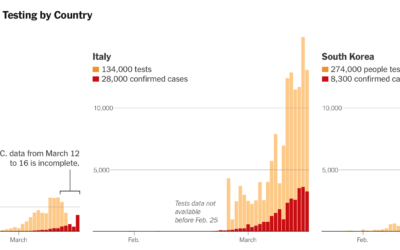
Lagging coronavirus testing in the US
Coronavirus testing in the United States has been a slow process to say…
-
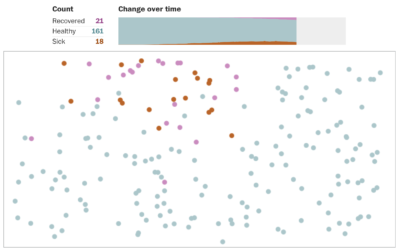
Simulations for virus spread with social distancing
Social distancing is the game plan these days. Try to stay at home…




 Visualize This: The FlowingData Guide to Design, Visualization, and Statistics (2nd Edition)


