The New York Times has a rundown of what happened on Super Tuesday, with five takeaways. One of the sections uses a ternary plot to show support for Sanders, Biden, and other candidates:
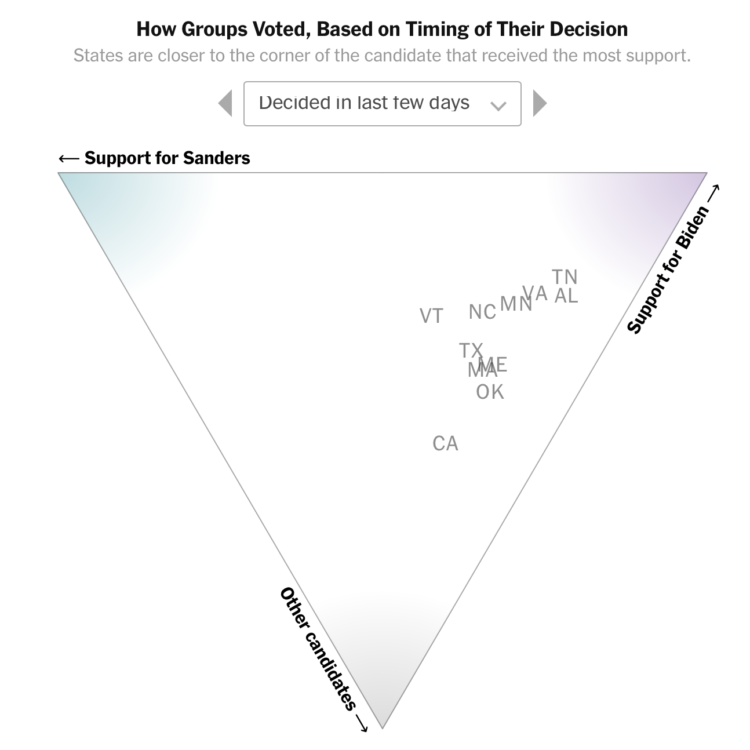
In case you’re unfamiliar, a ternary plot shows the ratios of three variables as a single position. In this case, the variables are support for Sanders, Biden, and Other. More support moves a point closer to the respective corner of the triangle.

 Visualize This: The FlowingData Guide to Design, Visualization, and Statistics (2nd Edition)