Every ten years since 1952, Sight and Sound, a British film magazine, has…
Infographics
Telling stories with data and graphics.
-

Tour through the greatest movies of all time
-

Managing temperature fluctuations through UK architecture
Philip Kennicott, Simon Ducroquet, Frank Hulley-Jones and Aaron Steckelberg, for The Washington Post,…
-
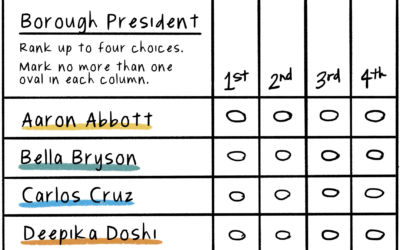
Illustration of ranked-choice voting
Connie Hanzhang Jin and Kaitlyn Radde, for NPR, used illustrations to explain how…
-

All the parts of daily life in India controlled by Mukesh Ambani
Mukesh Ambani has an estimated net worth of $90.7 billion, because his company…
-

8 billion population visualized
Here’s a fun interactive from The Washington Post to earmark the world reaching…
-

History of wars and power in Europe, animated from 1500 to present
Agar.io is a multiplayer game where people control cells in a Petri dish-type…
-

Daylight saving time and circadian rhythms
Daylight saving time ends in the United States this weekend and ended already…
-
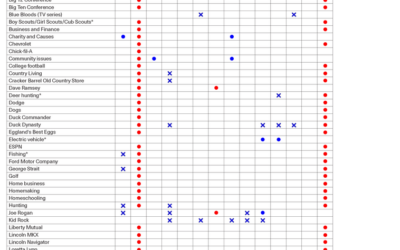
How you might vote based on what you like
By Angie Waller, this table shows how Facebook thinks you’ll vote based on…
-

What hearing loss sounds (and looks) like
Using an audiogram as a backdrop, Amanda Morris and Aaron Steckelberg, for The…
-

Chartball is sports data visualized in a playful way
With Chartball, Andrew Garcia Phillips has visualized sports data for a while, publishing…
-
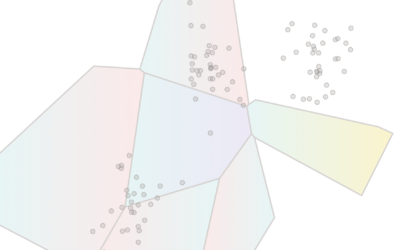
K-Means clustering visually explained
Say you want to identify clusters in a scatterplot of points. K-Means is…
-

Coffee versus tea in charts
Anahad O’Connor, Aaron Steckelberg and Garland Potts, for The Washington Post, made charts…
-

Tree Talk
Kelton Sears used a vertical scroll upwards to think about trees and time.…
-

Days-since tickers for all the natural disasters
You know those signs in workplaces that keep track of days since injury?…
-
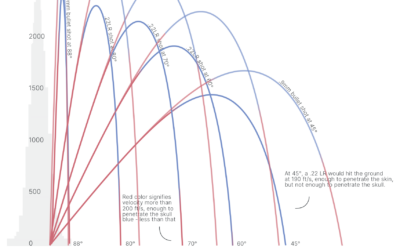
Trajectories of celebratory gunfire
When someone fires a gun into the air, the bullet travels thousands of…
-

Sonic landscape of Mexico City
Aaron Reiss and Oscar Molina Palestina, for The Pudding, explore the sounds of…
-
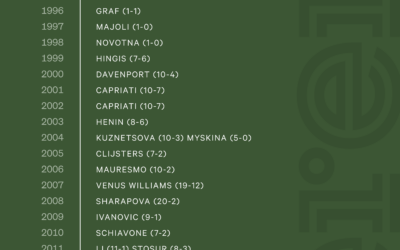
Serena Williams beat every Grand Slam champion
Serena Wiliams’ tennis career is impressive for its success and longevity, which are…
-
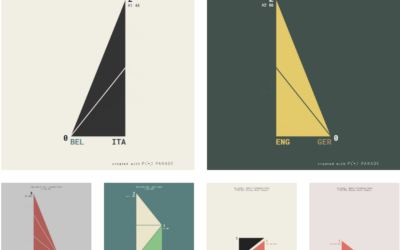
Animated charts to show sports results
Krisztina Szűcs likes to make animated charts to show sports results, from fencing,…
Recently for Members
Second Edition
 Visualize This: The FlowingData Guide to Design, Visualization, and Statistics (2nd Edition)
 Visualize This: The FlowingData Guide to Design, Visualization, and Statistics (2nd Edition)
New tools, refined process.
Browse by Chart Type See All →


