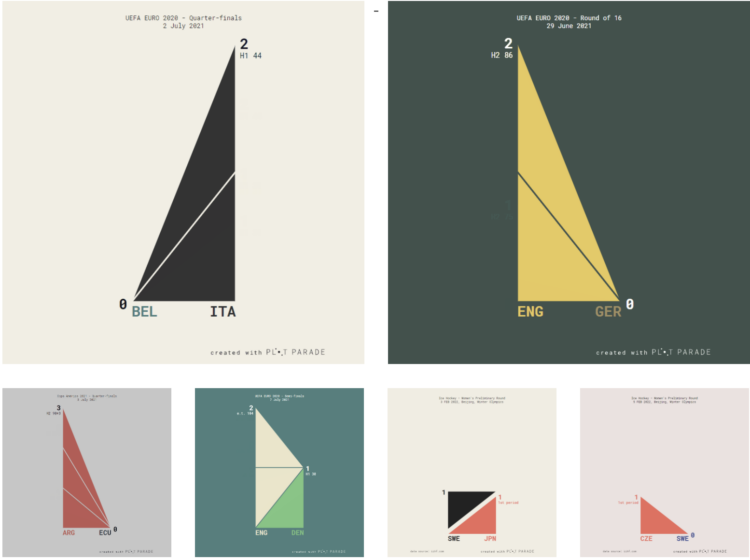
Krisztina Szűcs likes to make animated charts to show sports results, from fencing, handball, soccer, to hockey. She cataloged all of her sports charts in one place. I’m partial to the triangle timelines, which play well to sports with back and forth scores.
Animated charts to show sports results
Second Edition
 Visualize This: The FlowingData Guide to Design, Visualization, and Statistics (2nd Edition)
 Visualize This: The FlowingData Guide to Design, Visualization, and Statistics (2nd Edition)
New tools, refined process.