Instead of using a bunch of equations to memorize, Yi Zhe Ang visually…
Yi Zhe Ang
-
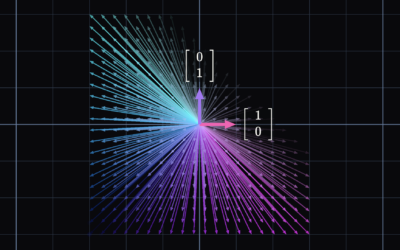
Explorable explanation for matrix transformations
-
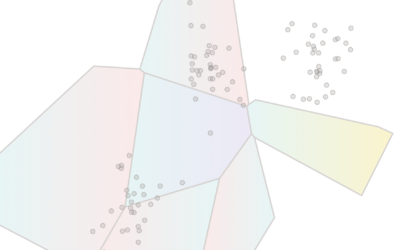
K-Means clustering visually explained
Say you want to identify clusters in a scatterplot of points. K-Means is…
Recently for Members
Second Edition
 Visualize This: The FlowingData Guide to Design, Visualization, and Statistics (2nd Edition)
 Visualize This: The FlowingData Guide to Design, Visualization, and Statistics (2nd Edition)
New tools, refined process.
Browse by Chart Type See All →


