There’s a data visualization book bundle on Humble Bundle this month. Get twenty-two…
Nathan Yau
-
Data Visualization Humble Bundle
-
Why the galaxy pictures from the Webb telescope are pretty cool
The first public picture from the James Webb telescope is kind of cool…
-
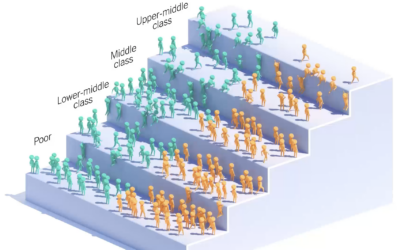
Income ladder for the children of immigrants
You’ve probably seen the moving bubbles that show how something changes over time.…
-
A lot of galaxies
NASA released an image from the Webb First Deep Field telescope, which shows…
-
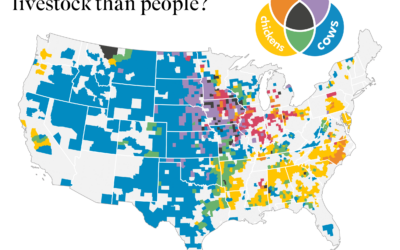
Where there is more livestock than people in the United States
The United States Department of Agriculture provides annual inventory data on livestock, crops,…
-
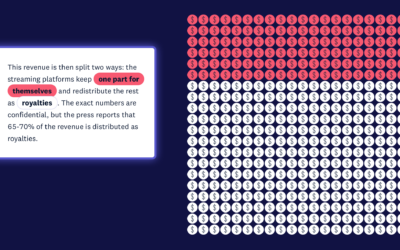
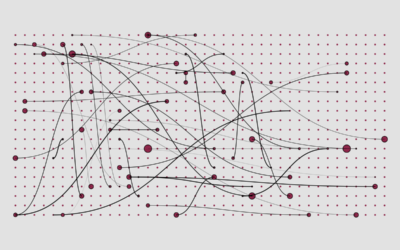
Money distribution for streaming music
From the listener perspective, we pay our monthly or annual fees and just…
-
Members Only
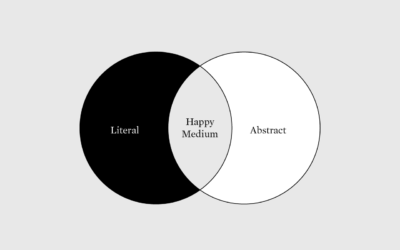
More Literal, Less Abstract
Use visual metaphors to shorten the distance between data and what it represents.
-
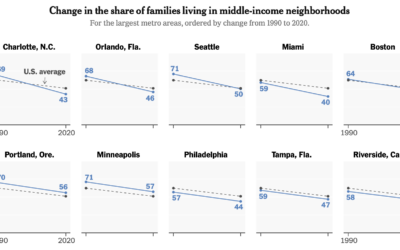
Shrinking middle-class
Income distribution continues to stretch on the high end and squish on the…
-
Absurd trolly problems
You’ve probably heard of the trolley problem, a thought experiment that imagines a…
-
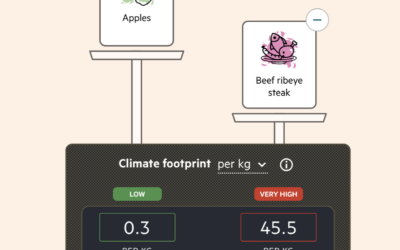
Imagining carbon food labels
By purchasing certain foods, we make decisions about the carbon footprint from the…
-
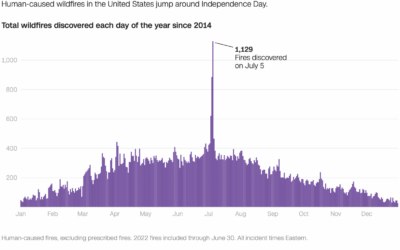
Wildfires caused by fireworks
It’s Independence Day here in the United States, which means there will be…
-
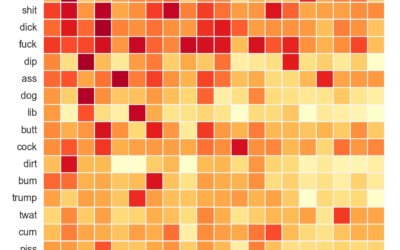
Analysis of compound curse words used on Reddit
As you know, Reddit is typically a sophisticated place of kind and pleasant…
-
Members Only
Visualization Tools and Learning Resources, June 2022 Roundup
Here’s the good stuff for June.
-
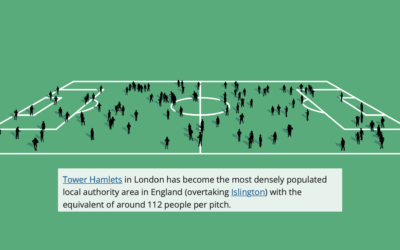
Football field to show population change in the UK
The Office for National Statistics for the UK published an interactive to show…
-
15 years
This past weekend marked 15 years since I first posted on FlowingData. What…
-
Visualising Knowledge
Visualising Knowledge is an open book from PBL Netherlands Environmental Assessment Agency, based…
-
Introduction to statistical learning
An Introduction to Statistical Learning, by Gareth James, Daniela Witten, Trevor Hastie, and…
-
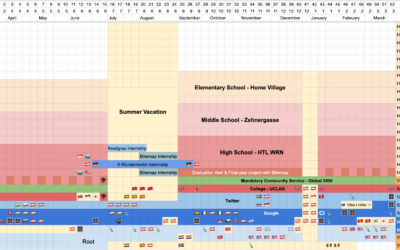
Personal life dashboard
Felix Krause tracks many metrics of his life, both manually and passively, and…
-
Active shooter endings
For The New York Times, Larry Buchanan and Lauren Leatherby used Sankey diagrams…
-
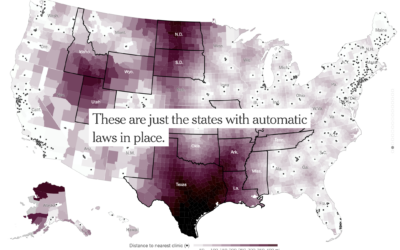
Increased distance to the nearest clinic
With Roe vs. Wade in place, there were areas in the United States…







 Visualize This: The FlowingData Guide to Design, Visualization, and Statistics (2nd Edition)


