Data for the 2022 Survey of Consumer Finances, from the Federal Reserve Board,…
Nathan Yau
-
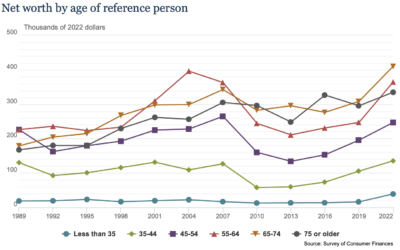
Data on net worth, income, and savings
-
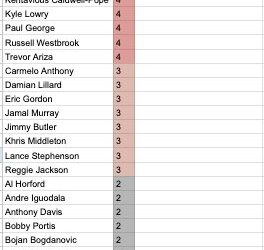
When Mike Breen announces “Bang!”
Mike Breen is a well-known NBA basketball announcer. When a player hits a…
-
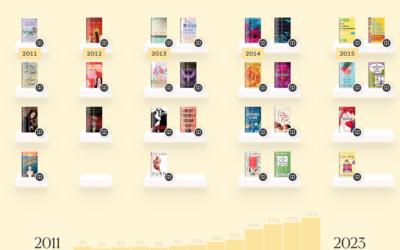
Analysis of romance novel covers
When I was a kid, I remember uncomfortably walking past the book section…
-

Google Maps and 3D experiments
The Google Maps API lets you access high-resolution 3D map tiles now. Robert…
-

Evolution of race categories in U.S. Census forms
For The New York Times, K.K. Rebecca Lai and Jennifer Medina show the…
-
Members Only

Making Dents
Every now and then, the work can feel like too much, but that usually means I’ve lost sight of the point.
-
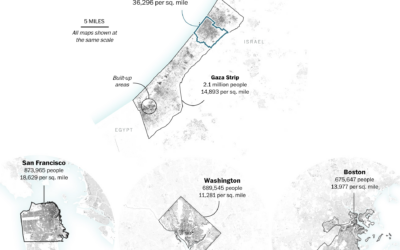
Gaza Strip size compared to U.S. cities
One of the most straightforward ways to help others better understand the scale…
-
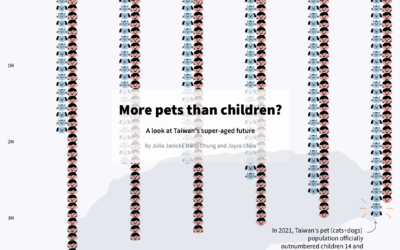
More pets than children in Taiwan
Julia Janicki, Daisy Chung, and Joyce Chou explore Taiwan’s aging population, where in…
-
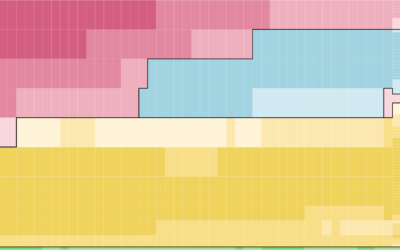
Most Common Causes of Death, by Age
This is how the most common causes have changed over time for people aged 0 to 85.
-
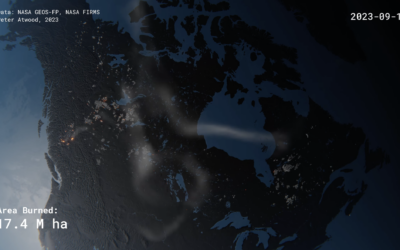
Realistic rendering of Canada’s wildfires
Peter Atwood used NASA data to depict the wildfires in Canada this year.…
-
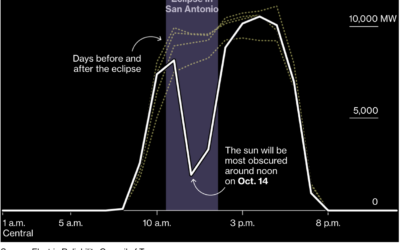
Dip in solar generation during the solar eclipse
Solar power is clean and all, but what happens when the sun is…
-
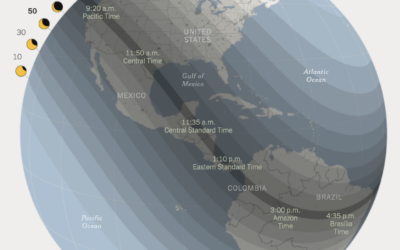
Map of the 2023 solar eclipse
The moon is going to get in the way of the sun this…
-
Members Only
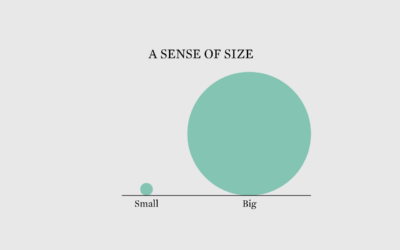
Scale of Things
Whether a difference seems big or small, important or not, depends on the scale you choose.
-
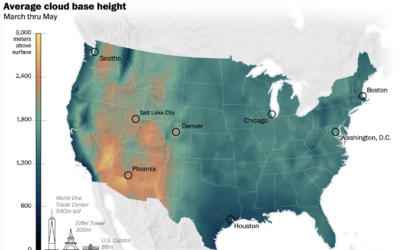
Where the clouds are the highest
Cloud formation depends on temperature and moisture levels, so in places of high…
-
Members Only
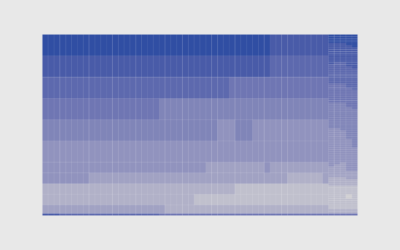
How to Make a Heatmap with Irregular Bins in R
There are existing functions and packages to make heatmaps in R, but when the data is irregular, it’s worth going custom.
-
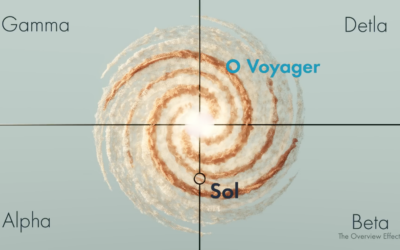
Real space location of Star Trek and other science fiction
Star Trek and related might be fictional, but they usually reference real stars,…
-
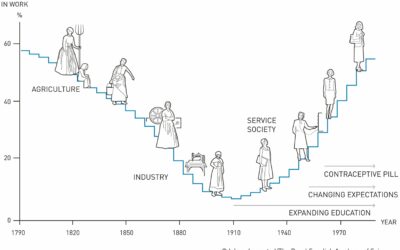
Nobel Prize for research in global labor markets, using historical data
Claudia Goldin, an economist at Harvard, has won the Nobel Prize in Economics.…
-

Mapping Israel and Gaza attacks
The New York Times is mapping rocket strikes, attacks, and ongoing conflict in…
-
News organizations blocking OpenAI
Ben Welsh has a running list of the news organizations blocking OpenAI crawlers:…
-
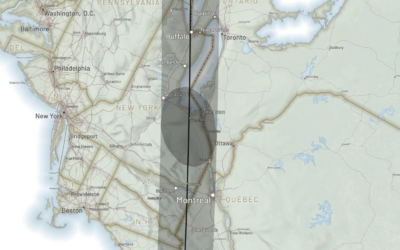
Following the path of the 2024 solar eclipse
There is going to be a solar eclipse on April 8, 2024. The…
Recently for Members
Second Edition
 Visualize This: The FlowingData Guide to Design, Visualization, and Statistics (2nd Edition)
 Visualize This: The FlowingData Guide to Design, Visualization, and Statistics (2nd Edition)
New tools, refined process.
Browse by Chart Type See All →


