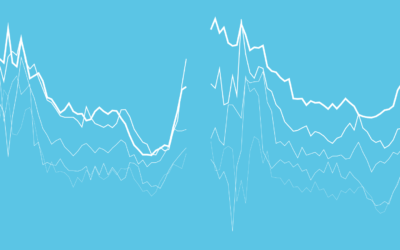
Sometimes it’s useful to animate the multiple lines instead of showing them all at once.
Nathan Yau
-
Members Only
How to Make Animated Line Charts in R
-
Marrying Later, Staying Single Longer
Using a century of data, we watch the shift of marital status in the United States.
-

Detailed satellite view of iceberg break
Using the thermal signature, NASA provides a detailed view of the break:
The… -

Hidden oil patterns on bowling lanes
This explainer video by Vox on the oil patterns on bowling lanes was…
-
Look to the data collection
Mimi Onuoha on the importance of paying close attention to the data collection…
-
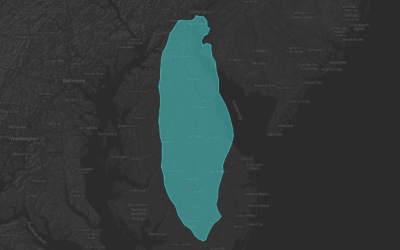
Iceberg scale, as described in different countries
A giant iceberg broke off from Antartica. Like, really big. Quartz collected the…
-
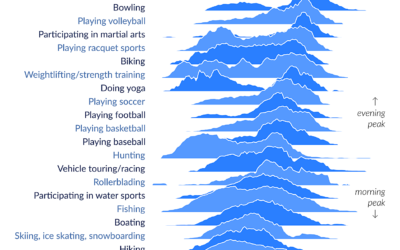
Peak times for leisure and sports
The American Time Use Survey asks people what they do during the day.…
-
Every solar eclipse in your lifetime
The continental United States gets a total solar eclipse on August 21, so…
-

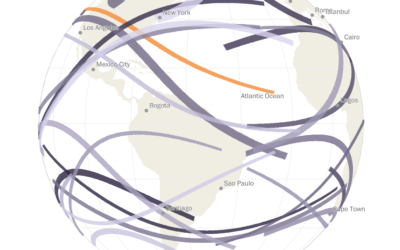
Infinite Twitter ad campaign, based on data profiles
As you probably know, Twitter (and all social media) collects data about you…
-
Summary Statistics Tell You Little About the Big Picture
Mean, median, and mode. These are the first things you learn about in…
-

Test how well you can draw the states
Chris Wilson for Time has a fun piece up that tests how well…
-

Temperature simulation near the Earth’s core
Researchers are building models to simulate the Earth’s core. From CNRS News:
Take… -

Married People Have More Sex
The relationship and dynamics change. Less lust, more companionship. Is that really how it works?
-

Empty bladder vs. full bladder
I always enjoy the data sketches that Mona Chalabi posts on Instagram. She…
-
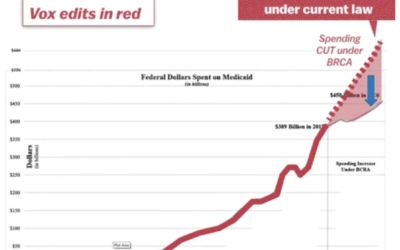
Misleading Medicaid funding with the baseline
The administration tweeted a chart that shows the Senate Republican health care bill…
-
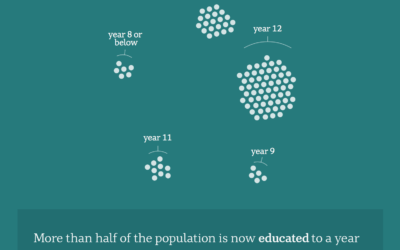
Australia as 100 people
Opting for the force-directed clusters route, Catherine Hanrahan and Simon Elvery for ABC…
-
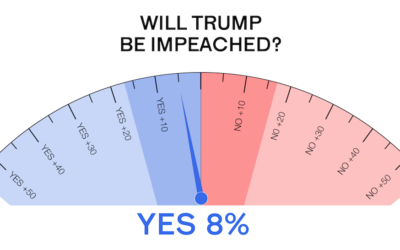
Trolling the uncertainty dial
During the election last year, The New York Times ran an uncertainty dial…
-
Alone Time
It’s harder to make friends as you get older. There aren’t as many…
-
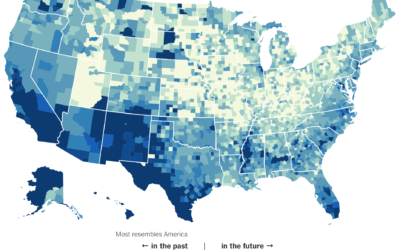
Parts of America that most resemble the future
The Census Bureau released estimates for demographic breakdowns for each county — in…
-
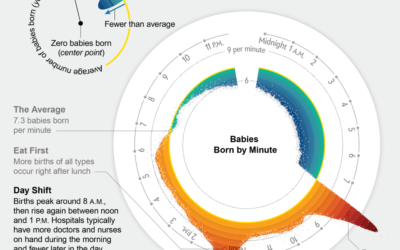
When babies are born, the cycle
Movies would have you believe that birth is random and unpredictable. (And if…
Recently for Members
Second Edition
 Visualize This: The FlowingData Guide to Design, Visualization, and Statistics (2nd Edition)
 Visualize This: The FlowingData Guide to Design, Visualization, and Statistics (2nd Edition)
New tools, refined process.
Browse by Chart Type See All →


