The Rush Hour puzzle game was invented by Nob Yoshigahara in the 1970s…
Nathan Yau
-
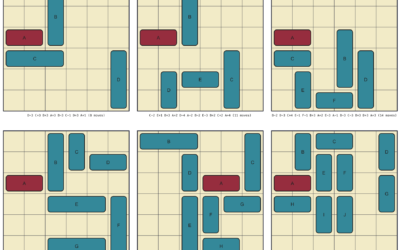
Rush Hour puzzle solver and generator
-
Changing Twitter, with Statistics
Earlier this year, The New York Times investigated fake followers on Twitter showing…
-
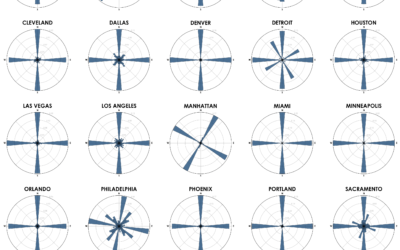
Street network orientation in major cities
Using OpenStreetMap data, Geoff Boeing charted the orientation distributions of major cities:
Each… -
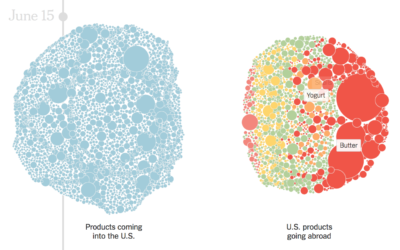
Products with tariffs in the trade war
The trade war started in January of this year when the administration imposed…
-
Doing good data science
Mike Loukides, Hilary Mason, and DJ Patil published a first post in a…
-

Composite image of a spider building its web
Christian Fröschlin combined 2,800 frames of a spider building its web for this…
-
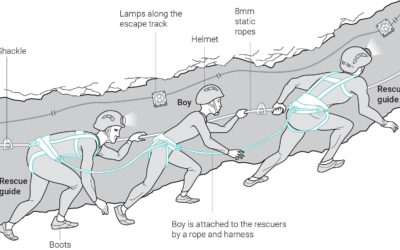
Graphics explaining Thai boys rescue
The eighth Thai boy was rescued from the flooded cave recently. Great news.…
-

Visualizing Patterns on Repeat
Things have a way of repeating themselves, and it can be useful to highlight these patterns in data.
-
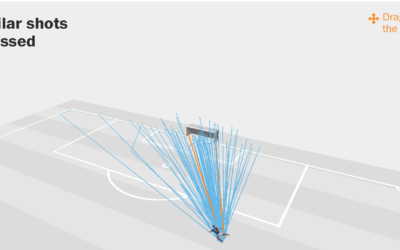
Expected versus actual goals in the World Cup
Benjamin Pavard from France made a low-probability goal the other day. Seth Blanchard…
-
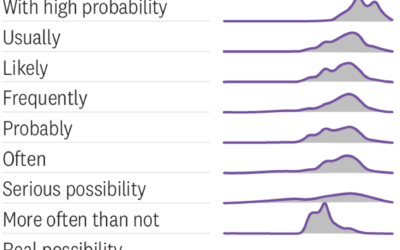
How people interpret probability through words
In the early 1990s, the CIA published internal survey results for how people…
-
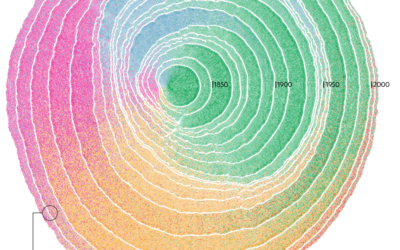
Immigration in the United States visualized as rings of tree trunk
Pedro M. Cruz, John Wihbey, Avni Ghael and Felipe Shibuya from Northeastern University…
-
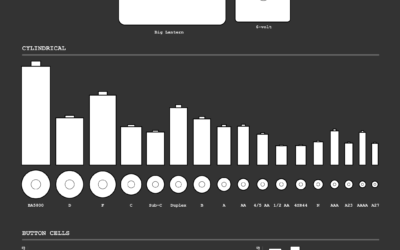
A Diagram of All the Batteries
After an unsuccessful battery search, the natural next step was of course to look up battery sizes and chart all of them.
-

All the building footprints in the United States
Microsoft released a comprehensive dataset for computer-generated building footprints in the United States.…
-
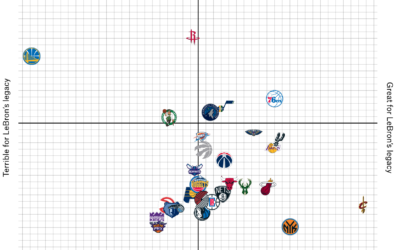
LeBron James legacy versus championship-winning
LeBron James decides where he takes his talents this summer, and the sports…
-

Why People Make Bad Charts (and What to Do When it Happens)
It’s important to consider the reasons so that we don’t overreact. Otherwise, we’re just berating, pointing, and laughing all of the time, and that’s not good for anyone.
-
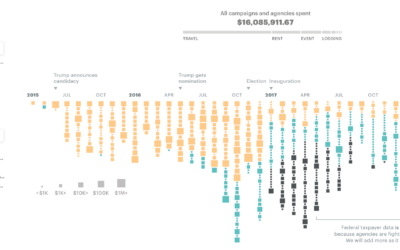
$16.1m in political and taxpayer spending at Trump properties
ProPublica compiled spending data from a wide range of sources to calculate the…
-
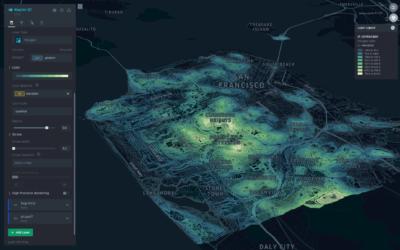
Kepler.gl, an open source tool for mapping large-scale spatial data
Kepler.gl, a collaboration between Uber and Mapbox, allows for easier mapping of large-scale…
-
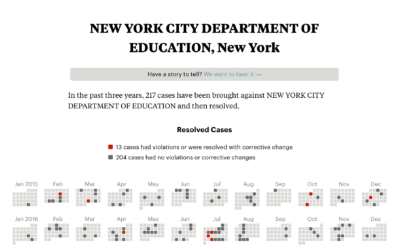
Check if your school district or college was investigated for civil rights violations
The U.S. Department of Education constantly investigates school districts and colleges for civil…
-

Same money, different counting strategies
Condé Nast Traveler got 70 people from 70 different countries to count money…
-
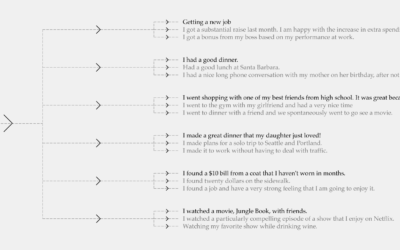
What Makes People the Most Happy
It’s in the details of 100,000 moments. I analyzed the crowd-sourced corpus to see what brought the most smiles.
Recently for Members
Second Edition
 Visualize This: The FlowingData Guide to Design, Visualization, and Statistics (2nd Edition)
 Visualize This: The FlowingData Guide to Design, Visualization, and Statistics (2nd Edition)
New tools, refined process.
Browse by Chart Type See All →


