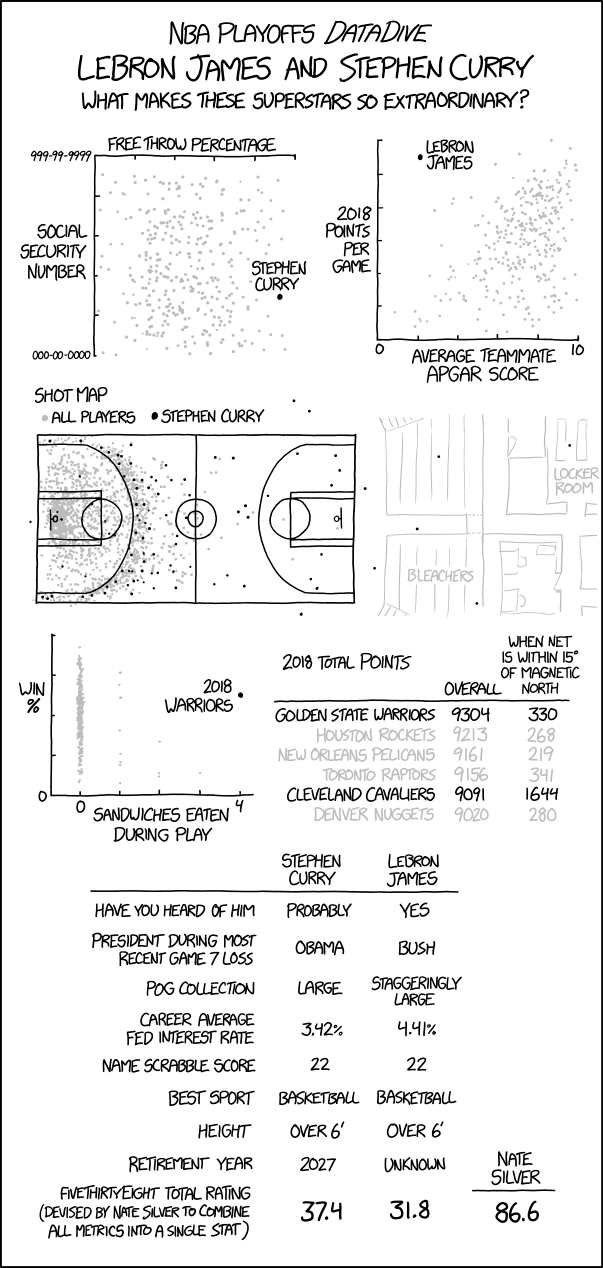
xkcd. Sometimes sports statistics are far-fetched.
xkcd: LeBron James and Stephen Curry pseudo-greatness
Second Edition
 Visualize This: The FlowingData Guide to Design, Visualization, and Statistics (2nd Edition)
 Visualize This: The FlowingData Guide to Design, Visualization, and Statistics (2nd Edition)
New tools, refined process.