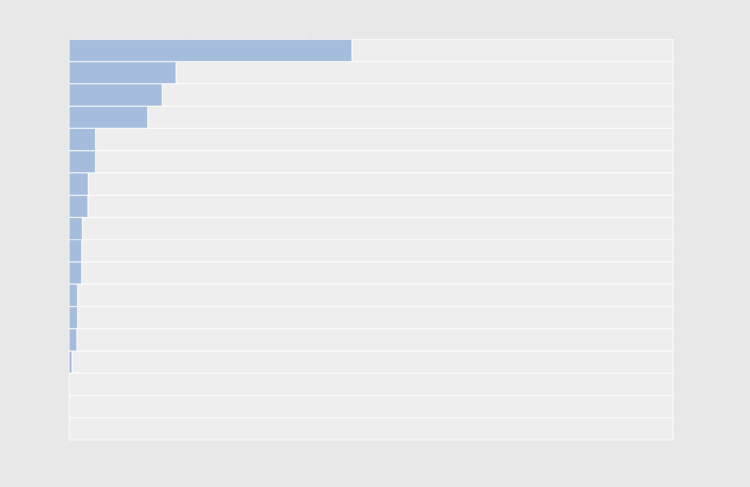
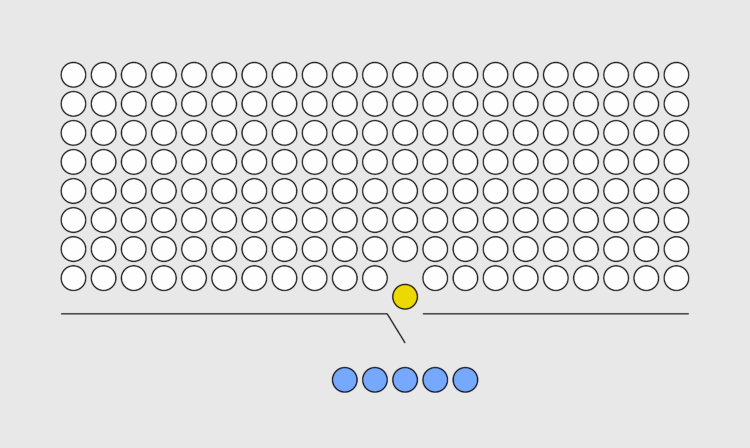
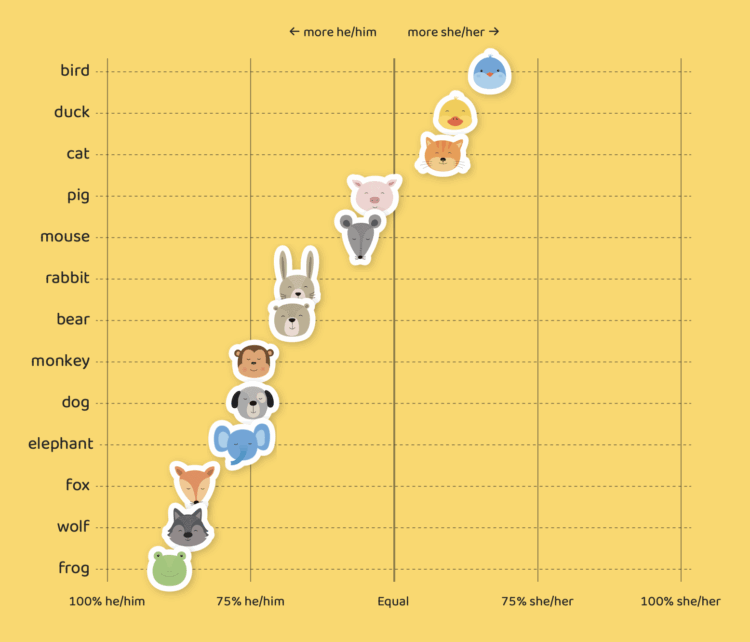
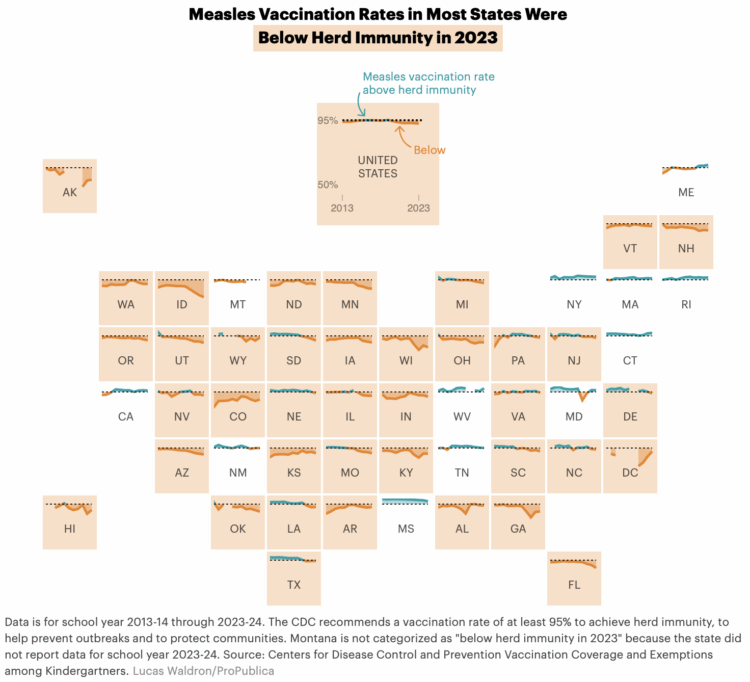
• In efforts to reduce repeat offenses in Spain thirty years ago, researchers developed a formula that assigned a risk score to individuals. The score was used to decide if prisons should grant a prisoner temporary release, and the formula still factors into decision-making today. Civio describes the current downsides of using the scores, which are based on a relatively small sample of prisoners from the 1990s.

    An interactive graphic, shown above, illustrates the system and how a score goes up and down as you change variables in the drop-down menus. Foreign status increases the risk score the most, even more so than if a prisoner tried to escape.

  • For Axios, Marc Caputo reports:

    Secretary of State Marco Rubio is launching an AI-fueled “Catch and Revoke” effort to cancel the visas of foreign nationals who appear to support Hamas or other designated terror groups, senior State Department officials tell Axios.

    Why it matters: The effort — which includes AI-assisted reviews of tens of thousands of student visa holders’ social media accounts — marks a dramatic escalation in the U.S. government’s policing of foreign nationals’ conduct and speech.

    Something tells me that the view into the system’s usage, classification process, and underlying data will be quite fuzzy.

  • Members Only

    This week is about highlighting changes in data visually to make them glaringly obvious.

  • Amanda Shendruk and Catherine Rampell, for Washington Post Opinion, highlight the current strategies of removing data from public view so there’s no baseline to compare against.

    Curating reality is an age-old political game. Politicians spin facts, cherry-pick and create “truth” through repetition. Statistical sleight of hand has long been part of that tool kit, as has burying inconvenient numbers. (In 1994, for instance, U.S. lawmakers blocked federal data collection on “green” gross domestic product.) But Trump’s statistical purges have been faster and more sweeping — picking off not just select factoids but entire troves of public information.

    The deletions self-contradict when the same groups are also saying that “data does not lie” in reference to spending cuts and takedowns. Why delete all the truth about how the United States functions, how we live, and where we are headed?

  • According to data from ActivTrak, people are shortening their work days with higher productivity. For Bloomberg, Nibras Suliman reports on the 36 fewer minutes at the end of 2024 when compared to 2022.

    I don’t know anything about ActivTrak, so I wonder what kind of work they track and how they measure productivity. Either way, it’s good to see minutes going down. I think we could stand to work less, myself included.

  • This might come as a surprise to some, but since congestion pricing in Manhattan began, the number of complaints about honking declined. For The City, Jose Martinez and Mia Hollie looked at the 311 service data:

    “One more reason to love congestion relief — less honking,” Juliette Michaelson, the MTA’s deputy chief of policy and external relations, said in a statement to THE CITY. “Turns out it is, in fact, possible to make Manhattan a little more peaceful.”

    In addition, between Jan. 5 and March 4, the two Department of Environmental Protection noise cameras south of 60th Street didn’t issue a single horn-honking summons, according to numbers provided by the city agency. In contrast, those two cameras issued 27 summonses for excessive horn blowing during the same time period last year.

    311 service data can be found here.

  • In almost every dataset about life and people that stretches back past March 2020, you can find the blip when Covid changed how we live. Aatish Bhatia and Irineo Cabreros, for NYT’s the Upshot, used a stack of 30 charts to show the shifts.

    Each chart shows a pre-Covid gray on the left and a post-Covid red-orange on the right. The lines (or bars) on the post-Covid side extend the past when you scroll. Usually charts that show an empty space to start and then animate the rest are gimmicks, but the extensions highlight the sudden changes in this series.

    The scroll style and dimensions are very mobile-first, as the stack plays out in a more familiar way on a phone. The style also makes the 30 charts feel like not too much.

  • From Pew Research, this political typology quiz is from four years ago but is as relevant as it was then. Answer a handful of questions and see where you fall in the spectrum of nine groups. As the split between Democrat and Republican in the U.S. grows wider, maybe that means it gets easier to see the differences and similarities in the space between.

    On the methodology to define the groups:

    The typology groups are created with a statistical procedure that uses respondents’ scores on all 27 items to sort them into relatively homogeneous groups. The specific statistical technique used to calculate group membership is weighted clustering around medoids (using the WeightedCluster package version 1.4-1 in R version 4.1.1). The items selected for inclusion in the clustering were chosen based on extensive testing to find the model that fit the data best and produced groups that were substantively meaningful. Most prior Pew Research Center typologies used a closely related method, cluster analysis via the k-means algorithm, to identify groups.

  • Alvin Chang, for the Pudding, highlights education research on the awkwardness of middle school (or junior high as they used to call it (or intermediate where I’m from)).

    What they found across the country was that 6th, 7th, and 8th graders who attend middle schools learn less, while feeling lower levels of belonging and self esteem, when compared to kids who attend K-8 schools. One 2010 study of New York City students found that, when kids transition to middle school, their parents feel like the quality of education and safety of the schools is worse compared to the parents of students who still attend K-8 schools.

    I would have assumed that the transition year from being the oldest in elementary school to the youngest at a new school was when the sense of belonging was lowest. Instead, in the study, belonging also decreased in 7th and 8th grades and leveled out in high school.

    Although, as we exit elementary school, I can see how a transition from collective to distinct identities would shift the sentiment.

    Chang frames the story as a conversation between adult and students. He shows individual data points as the top half of student faces (with blinking eyes). They organize as you scroll and highlight the aggregates with a background color change to yellow.

    There is also a video version with music and narration by Chang. I think it nudges past the interactive.

  • Last week, Disney laid off FiveThirtyEight employees and announced the site would cease operations. However, I did not realize that the end for the site and archives was also coming quickly. Links to past FiveThirtyEight projects loaded a usable and readable archive. Now you just get redirected to an outdated ABC News politics page.

    That’s a lot of solid work that just poofed out of existence.

    For now, the FiveThirtyEight GitHub page is still up. While it hasn’t been updated in a few years since the restructuring, the datasets in particular might be useful to download for teaching purposes (or a dumb chart about candy), while they’re still online.

  • For Our World in Data, Saloni Dattani and Lucas Rodés-Guirao analyzed the various factors that led to the baby boom, typically marked by the period following World War II. As usual, it’s not that simple.

    The baby boom is typically defined as the time period between 1946 and 1964. As an example, Brittanica’s entry on the baby boom states that it describes “the increase in the birth rate between 1946 and 1964”. Similarly, the US Census Bureau defines baby boomers as “those born between 1946 and 1964”, with the common belief that the baby boom started immediately after World War II.

    But as the chart below shows, the rise began earlier.

    Birth rates in the United States had been falling in the early twentieth century, and the decline began to slow down at the end of the 1920s. Then, in the late 1930s, they turned around and began to rise, and this continued during parts of World War II. At the end of the war, they surged, but this was part of a multi-decadal increase.

  • Members Only

    The first part of visualizing data usefully is making sure the data you’re working with is not terrible.

  • Elon Musk has been critical of government spending, as he and DOGE fire federal employees and post questionable savings numbers. However, Musk’s own companies have benefited greatly from government funds over the past two decades, especially during the last few years. The Washington Post has the charts showing the $38 billion.

    The total amount is probably larger: This analysis includes only publicly available contracts, omitting classified defense and intelligence work for the federal government. SpaceX has been developing spy satellites for the National Reconnaissance Office, the Pentagon’s spy satellite division, according to the Reuters news agency. The Wall Street Journal reported that contract was worth $1.8 billion, citing company documents.

    The Post found nearly a dozen other local grants, reimbursements and tax credits where the specific amount of money is not public.

  • Planet Money explains the Daily Treasury Statement from the U.S. Treasury. The data source itemizes deposits and withdrawals from and to government agencies.

    The Daily Treasury Statement (DTS) dataset contains a series of tables showing the daily cash and debt operations of the U.S. Treasury. The data includes operating cash balance, deposits and withdrawals of cash, public debt transactions, federal tax deposits, income tax refunds issued (by check and electronic funds transfer (EFT)), short-term cash investments, and issues and redemptions of securities. All figures are rounded to the nearest million.

    Access the data here, for now.

  • Nate Silver writes a few thoughts on the closing of FiveThirtyEight:

    For more extended thoughts on the environment at Disney — plus plenty of self-reflection/self-criticism — you can see the item at the bottom of SBSQ #12. But the basic issue is that Disney was never particularly interested in running FiveThirtyEight as a business, even though I think it could have been a good business. Although they were generous in maintaining the site for so long and almost never interfered in our editorial process, the sort of muscle memory a media property builds early in its tenure tends to stick. We had an incredibly talented editorial staff, but we never had enough “product” people or strategy people to help the business grow and sustain itself. It’s always an uphill battle under those conditions, particularly when it comes to recruiting and retaining staff, who were constantly being poached by outlets like the New York Times and the Washington Post.

    Silver also includes future plans for his Silver Bulletin paid newsletter, such as Trump approval ratings, college basketball ratings, and updated statistical models for the NBA and NFL. It kind of sounds like building up another version of FiveThirtyEight, with a more stable revenue stream.

  • Disney is cutting news jobs, and FiveThirtyEight, which was absorbed by ABC News and owned by Disney, is going with them. FiveThirtyEight employees were laid off this morning. It’s unclear what will happen to past projects and the brand itself, but I imagine those won’t stick around either.

    From G. Elliott Morris, who took over after Nate Silver left:

    As reported, the entire staff of 538 was laid off this morning. This is a severe blow to political data journalism, and I feel for my colleagues. Readers note: As we were instructed not to publish any new content, all planned updates to polls data and averages are canceled indefinitely. Huge loss :(

    After the layoffs a couple years ago and the shift from the dot com address to an abcnews address, it seemed like this was where FiveThirtyEight was headed, but still. It’s sad for those who make data things.

    At its peak, FiveThirtyEight got normal people interested in data and statistics, which is not an easy thing to do. Beyond politics, they provided a lens, a sometimes quirky one I especially enjoyed, that made it easier to understand how data played a role in the everyday.

    So tonight, we pour one out for Fivey Fox.

  • For The New York Times, Siobhan Roberts talked to mathematician and Fields Medal winner Alessio Figalli, who is known for his work in optimal transport. On creativity:

    Suppose you’re doing very good research in an area; your optimization scheme would have you stay there. But it’s better to take risks. Failure and frustration are key. Big breakthroughs, big changes, always come because at some moment you are taking yourself out of your comfort zone, and this will never be an optimization process. Optimizing everything results in missing opportunities sometimes. I think it’s important to really value and be careful with what you optimize.

  • For Bloomberg, Ira Boudway reports on NBA basketball going too far with the optimizations. First it’s fun and games, but then the product suffers:

    The NBA has fallen into an efficiency trap: Teams pursuing the optimal strategy for winning are doing damage to the quality of the product. The situation will be familiar to baseball fans. During the Moneyball revolution, front offices became obsessed with home runs, walks and strikeouts, the so-called three true outcomes. Games became stagnant without the bang-bang action of line drives, bunts and steals.

    The good news for the NBA is baseball also provides a road map out of such doldrums. In 2023, Major League Baseball introduced a set of rule changes, including pitch clocks, bigger bases and a ban on a defensive strategy known as the infield shift, intended to inject excitement back into the game. So far, it’s helped, leading to shorter games, more steals and increased attendance. The rollout of these changes should serve as a model for the NBA.

    I’m a Golden State Warriors fan, so three-point highlight reels are a source of joy. Stephen Curry and company were winning, by a lot. Other teams followed the strategy, naturally.

    Now the NBA has to adjust, because watching four guys, and sometimes all five, hang out on the perimeter every possession is sitting at the bottom of the trough. They have to optimize for entertainment now.

  • Speaking of imported vehicle parts, June Kim and Neal Boudette, for The New York Times, highlight how some vehicles are technically American-made but use mostly imported parts and others are technically imports but use mostly American-made parts.

    A vehicle like the Toyota RAV4, assembled in Canada with 70% American parts, would technically have to pay a 25% tariff. What counts as American-made?

  • To demonstrate how tariffs can impact American products, Financial Times focuses on the parts and manufacturing of a Chevrolet Silverado pick-up truck (paywalled). Over half of the 673,000 Silverados produced last year were built in Mexico and Canada.