Data continues on its upwards trajectory and with it comes the importance of visualization. Many charts were made in 2023. These are my ten favorites from the year.
2023
-
Best Data Visualization Projects of 2023
-
Members Only

Visualization Tools and Learning Resources, December 2023 Roundup
Here is the good stuff for December in the last roundup for 2023.
-

A phone charger that only works when you recharge yourself
Recharge, an art installation by Dries Depoorter, uses a system that detects when…
-
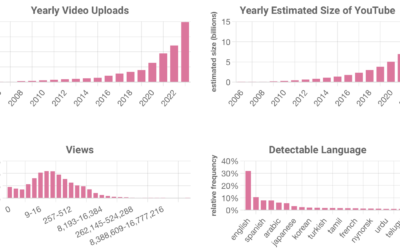
Estimating the size of YouTube
YouTube doesn’t offer numbers for how big they are, so Ethan Zuckerman and…
-
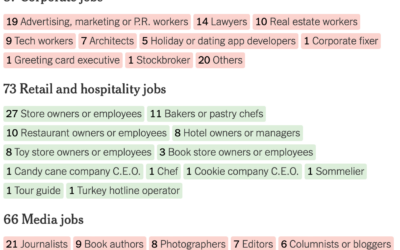
Breaking down the holiday movie formula
NYT’s The Upshot looked at 424 holiday movies released by the Hallmark and…
-
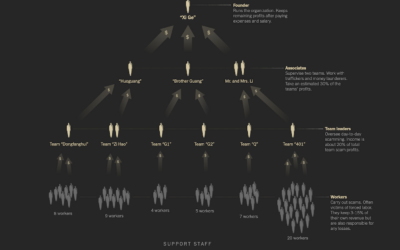
Tracking operations in an online scam labor camp
Neo Lu was scammed into a labor camp. In an effort to escape…
-
Members Only
Fun With Data
Here are some fun things to make with data in case you’re looking for a chart-ish distraction.
-

Scale of all the things, compared to you
Kurzgesagt illustrates the scale of the tiniest of things and the biggest of…
-
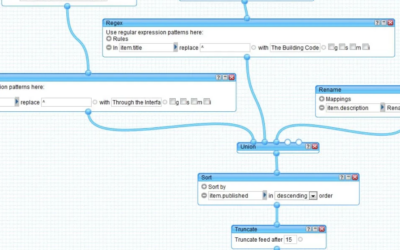
Visual history of Yahoo Pipes
For Retool, Glenn Fleishman looks back to a time when data on the…
-
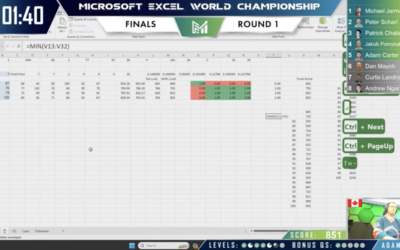
Excel World Championship
The Microsoft Excel World Championship 2023 wrapped a couple weeks ago, and the…
-
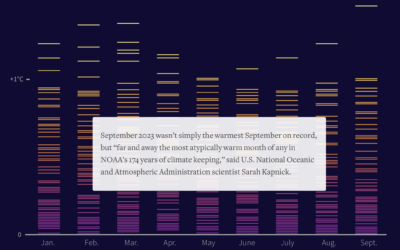
A hotter year, again
This year, 2023, was the hottest year on record. For Reuters, Gloria Dickie,…
-
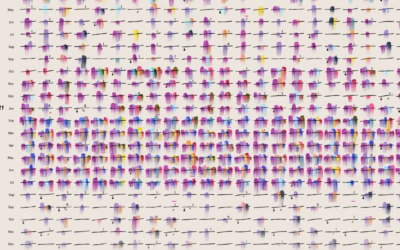
Data portrait of a life with long Covid
Giorgia Lupi, known for using data visualization to connect real life and numbers,…
-
Members Only
Relatable Units
Numbers are challenging to understand for many (most?) people, so it can help to use units of measurement that are relatable to readers to reduce friction between data and clarity.
-
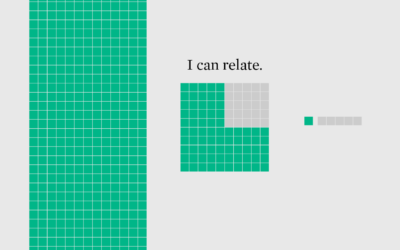
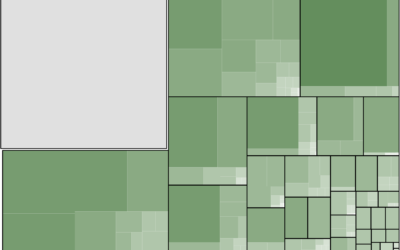
Common Millionaire Household
The status of seven figures is maybe not as rare as it seems.
-

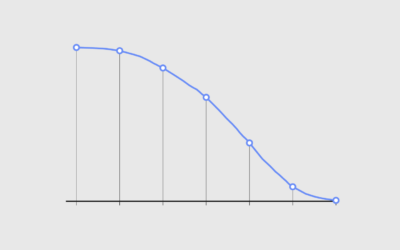
Generative plants
Generate your own plant with Max Richter’s interactive. Adjust leaf shape, density, and…
-
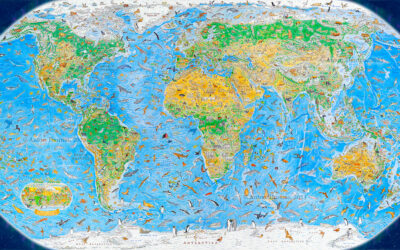
World map of illustrated animals
During a three-year span, Anton Thomas illustrated a world map of 1,642 animals…
-
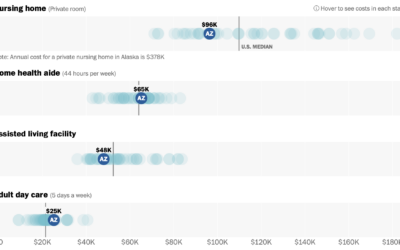
Cost of assisted living where you are
Assisted living can be expensive. For The Washington Post, Bonnie Berkowitz, Lauren Tierney,…
-
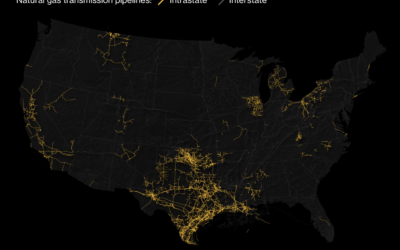
High concentration of intrastate pipelines in Texas
By keeping gas pipelines within the state, companies can avoid federal regulations. This…
-
Young Money
We often associate high income with older people, but young people can also earn higher incomes. Let’s see what those people studied and what they do for a living.
-
Members Only
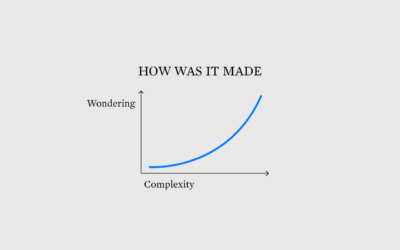
Figuring Out How a Visualization Was Made
One of the best ways to learn how to visualize data is to recreate a chart, but sometimes it’s unclear how that chart got made. What tool was used? What are the steps to make the chart with your own tools?
Recently for Members
Second Edition
 Visualize This: The FlowingData Guide to Design, Visualization, and Statistics (2nd Edition)
 Visualize This: The FlowingData Guide to Design, Visualization, and Statistics (2nd Edition)
New tools, refined process.
Browse by Chart Type See All →


