Knowing what’s next can help you work through a tedious step, because you know it’ll be worth it.
steps
-
Members Only

From Data to Finished Graphics
-
Members Only
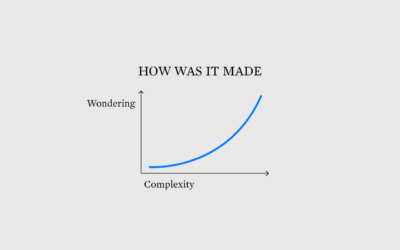
Figuring Out How a Visualization Was Made
One of the best ways to learn how to visualize data is to recreate a chart, but sometimes it’s unclear how that chart got made. What tool was used? What are the steps to make the chart with your own tools?
-
Members Only
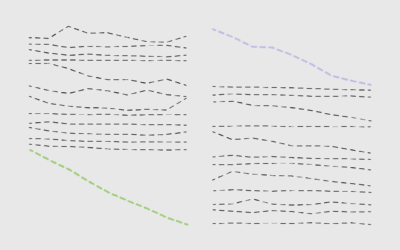
Sorting Usefully – The Process 169
A little bit of sorting and organization can make a big difference in readability.
Recently for Members
Second Edition
 Visualize This: The FlowingData Guide to Design, Visualization, and Statistics (2nd Edition)
 Visualize This: The FlowingData Guide to Design, Visualization, and Statistics (2nd Edition)
New tools, refined process.
Browse by Chart Type See All →


