With the World Cup in full swing, the New York Times has been…
-
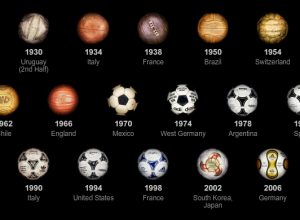
Evolution of the World Cup ball
-

Physics of oil spills explained
What exactly is going on with all the oil spewing into the Gulf,…
-
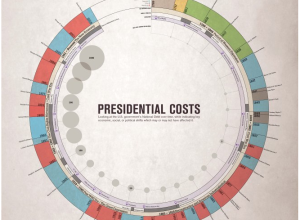
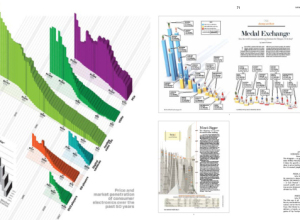
History of the United States in a circle
Presidential Costs by Rachel Mercer offers a look at the history of the…
-

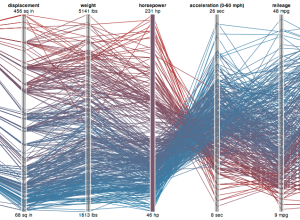
Landscape chartspotting
We saw math principles in nature. Now how about charts? Andy Woodruff does…
-
Twitter parade in your honor
This is completely useless in the good sort of way. Twitter parade, by…
-
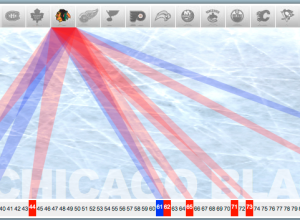
Stanley Cup winners and losers
Speaking of sports most Americans know nothing about, Robby Macdonell visualizes NHL Stanley…
-
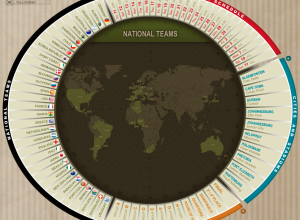
Interactive World Cup schedule
I was born in and live in the United States, so to me…
-
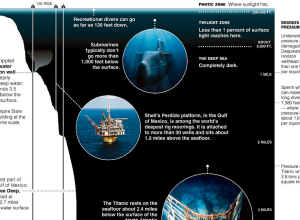
Context to underwater depths
The Deepwater Horizon well is nearly a mile deep in water. It extends…
-
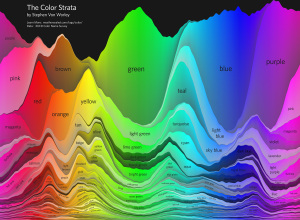
Strata of common and not so common colors
In another look at the data from xkcd’s color experiment, Stephen Von Worley…
-

Find your booty with Bing treasure maps
Maps on the major sites like Yahoo, Google, and Bing have a similar…
-
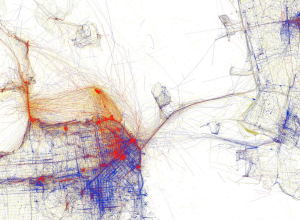
Where the tourists really flock
A couple of weeks ago you saw Eric Fischer’s maps of Flickr photos…
-
Review: Data Flow 2, Visualizing Information in Graphic Design
Note: The review copy I received is in French. Unfortunately, I only understand…
-
Europe’s web of debt
While the US has its own problems with debt somewhere in the range…
-
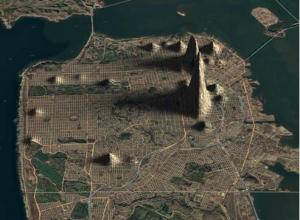
San Francisco crime mapped as elevation
Doug McCune maps San Francisco crime in 2009 as if it were elevation.…
-
Data and its impact on journalism
In regards to the UK’s recent boom in open data, Simon Rogers of…
-
Protovis 3.2 released – more examples and layouts
The most recent version of Protovis, the open-source visualization library that uses JavaScript…
-

Track the 2010 MTV Movie Awards
Excited about the 2010 MTV Movie Awards? Yeah, me neither. But if you…
-
Egregious Citations Issued to BP
BP processes about 1.5 million barrels of crude oil per day, across six…
-
How little musicians earn online
You’ve heard about the struggling musician. It’s a tough business. How tough is…
-
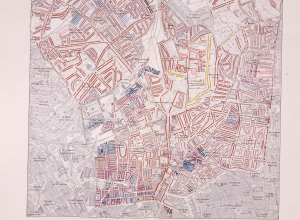
Poverty in late 19th century London
Alice Rawsthorn for The New York Times reports on Charles Booth’s London poverty…
Recently for Members
Second Edition
 Visualize This: The FlowingData Guide to Design, Visualization, and Statistics (2nd Edition)
 Visualize This: The FlowingData Guide to Design, Visualization, and Statistics (2nd Edition)
New tools, refined process.
Browse by Chart Type See All →


